
On this page
- 01 · Our verdict on Whatagraph after around 40 client dashboards
- 02 · What we use Whatagraph for every week
- 03 · The features that matter in practice
- 04 · Whatagraph pricing in US dollars, and what credits mean
- 05 · Where Whatagraph falls short
- 06 · Set up a first useful report in a day
- 07 · Questions we get about Whatagraph
- 08 · Sources
Our verdict on Whatagraph after around 40 client dashboards
Whatagraph is a marketing reporting platform. It pulls data from ad platforms, analytics and other sources into live dashboards and scheduled reports that you can brand as your own. We run around 40 live client dashboards on it, and every client report we send is built there.
Our verdict: Whatagraph is worth it for agencies, busy freelancers and in-house teams that report on many ad accounts. You pay for templates you duplicate, blends that turn several channels into one number, white-label PDFs on a schedule, and an MCP connector that lets Claude read and build reports. It is priced for that work: the Max plan starts at US$812 a month, billed annually.
Who it suits: agencies and multi-brand or multi-location teams with roughly 15 or more clients or brands to report on every week or month, which is where the 50 included credits start to pay their way. Who it does not suit: a single brand with one Meta ad account and one Google Ads account. Ads Manager, Google Ads' own reports and GA4, or a free dashboard tool, tell that owner what they need for far less money. Our Whatagraph alternatives guide shows which one to pick instead.
What we use Whatagraph for every week
Every client report we build starts from three sources: Meta Ads, Google Ads and GA4. Clients with SEO work get a Search Console tab, and we add Pinterest or TikTok tabs only where the client has real recent spend there. Monthly budgets and KPI targets flow from our client portal into a Google Sheet that Whatagraph reads, so targets sit next to actuals.
One master template
Our ecommerce template has seven tabs: Snapshot, Website data, Meta ads, Meta ads creative, Google ads, Audience and AI tracker. Lead generation clients get a leads version that shows spend, key events and cost per key event, with no ROAS. A new client report is a copy of the template: we swap in the client's sources, clone the ad blend and the MER blend, create the client's formula metrics, rebind every widget, then check each tile against the raw platform data before anyone sees it.
The Snapshot tab and the MER row
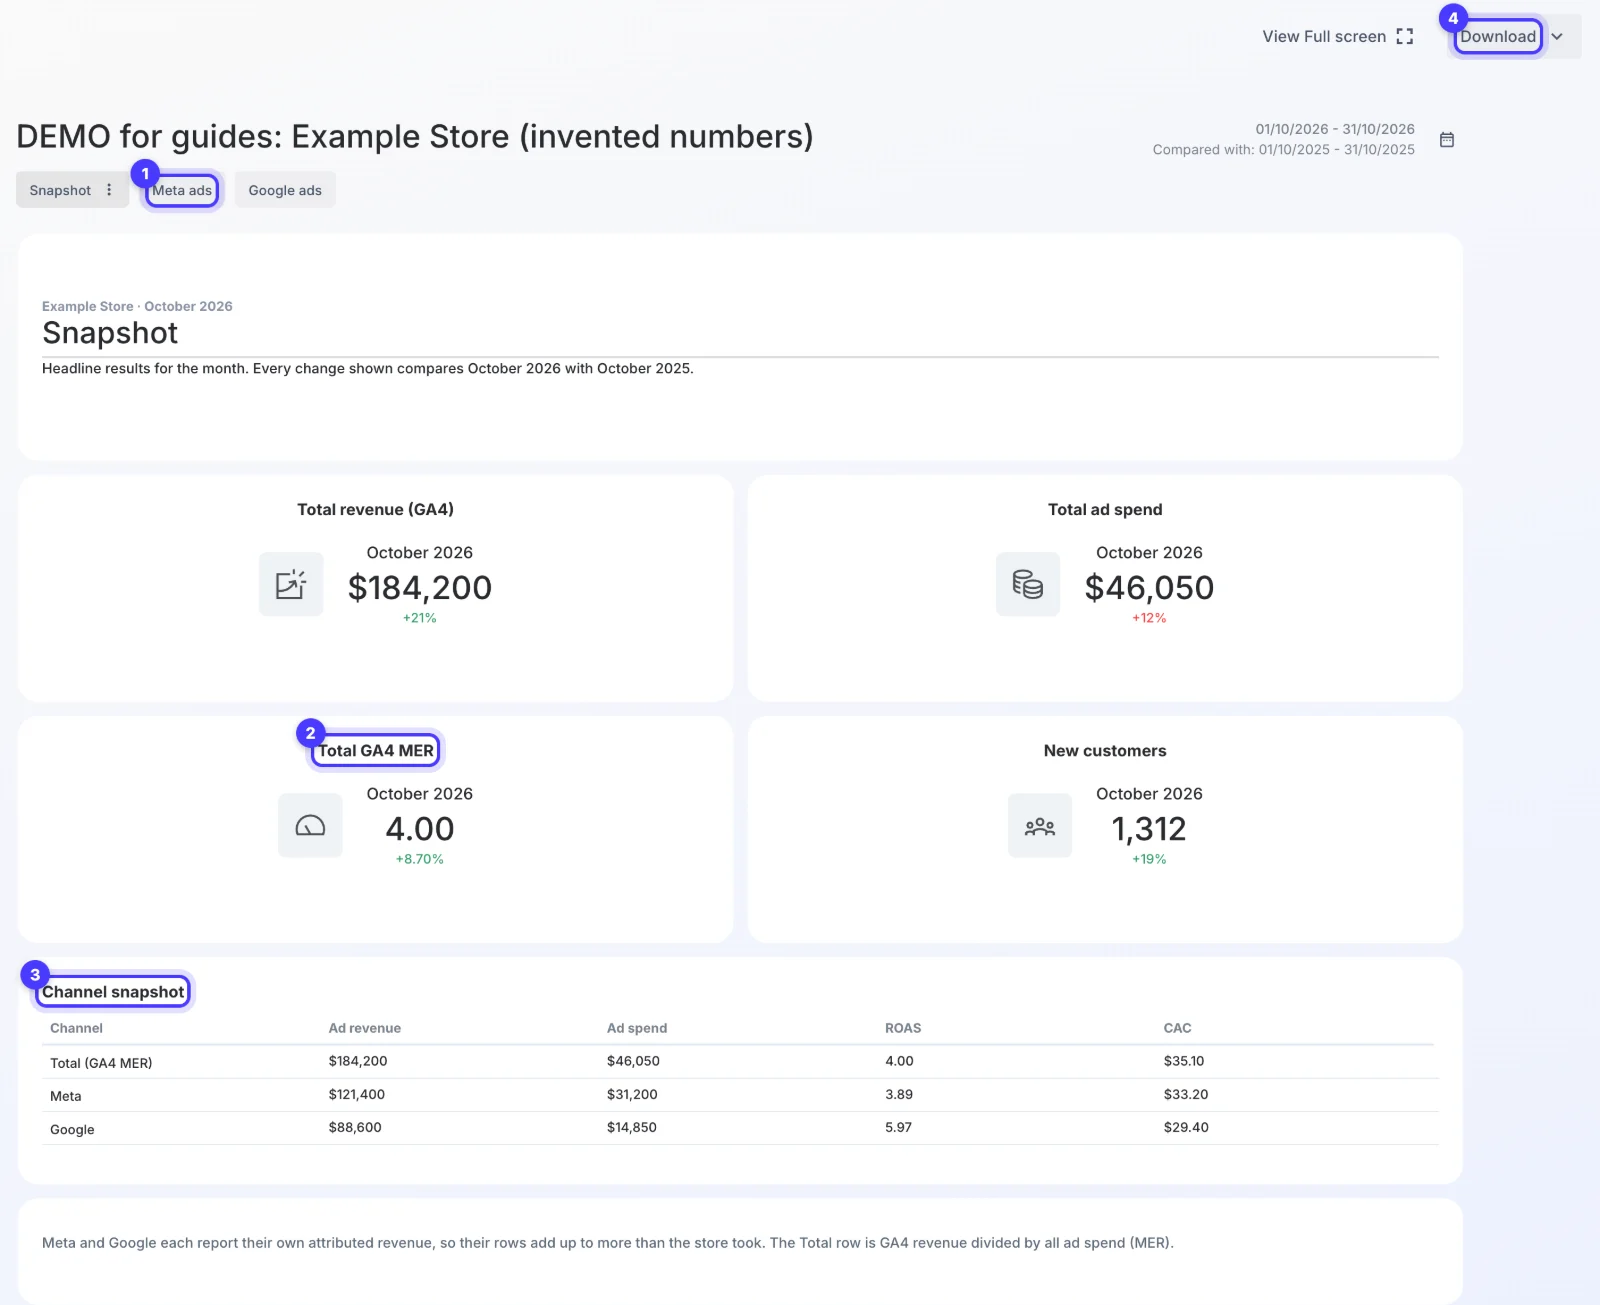
The first tab has one row per channel: Total, Meta, Google, then any others. Each row carries the channel's logo, ad revenue, ad spend, ROAS and customer acquisition cost (CAC). The Total row shows MER in place of ROAS: Meta spend plus Google spend against GA4 revenue, labelled "Total GA4 MER" so nobody mistakes it for the store's own revenue figure. We leave CAC off any channel that cannot tell new customers from returning ones, and we never add the channel revenue rows together, because Meta counts view-through purchases that overlap with GA4's. Our guide to MER vs ROAS explains why that row matters most.
Scheduled reports with the PDF attached
Live dashboards show a rolling last 30 days against the same period last year and refresh every four hours. Weekly and monthly reports are separate copies of each client's dashboard. Monthly reports go out on the 1st and weekly reports on Mondays, always with the PDF attached, on our own email theme that links to the client's portal. When a client asks whether a report went out, the automation history is our record, not the editor.
White-label and the portal embed
Reports carry our branding, with Whatagraph's "Powered by" header and footer switched off. Each client's Hey Sage portal embeds their approved live report from its public share link, with an open-in-new-tab button as a fallback. Our guide to white-label reporting covers that setup.
Claude and the Whatagraph connector
We use Whatagraph's MCP connector with Claude every day. Our daily SEO agent pulls Search Console and GA4 data through it. We run read-only audits of every client's ad account through it, several Claude agents at a time, and we build and edit reports through it. Refresh schedules and image uploads still happen in the Whatagraph app. Our Whatagraph MCP guide covers the setup and the prompts we use.

Run Better Ads. The free guide + vault.
137 pages on ecommerce ads, with 46 real ads and 17 landing pages taken apart.
The features that matter in practice
Five features carry most of our reporting.
- Blends. A blend joins several sources into one dataset. Our MER row is a blend of Meta spend and Google spend against GA4 revenue, and we clone it for every new client rather than rebuilding it.
- Formula metrics. Custom metrics let you define CAC, MER or cost per key event once and use them on any tile. ROAS on its own means little until you know your break-even ROAS, so we put the target next to it.
- Google Sheets as a source. Budgets and targets from our portal reach each report this way, so a tile can show spend against the month's budget.
- Share links with their own dates. A share link keeps its own date range, and that is the range the client sees. Check it before you send it.
- Source groups. We group accounts by client type, ecommerce or leads, to feed typical-client benchmarks in our portal. Those benchmarks use spend-weighted formulas, never a group's built-in ratio fields.
Unlimited users and reports on every plan means you never ration seats for account managers or clients. Max also lists KPI overviews with goals and alerts, version history and currency exchange. The integrations page lists 68 sources, among them Facebook Ads, Google Ads, GA4, Search Console, TikTok Ads, Pinterest Ads, Microsoft Advertising, Shopify and Klaviyo.
Whatagraph pricing in US dollars, and what credits mean
Whatagraph lists two plans, both billed annually. We checked whatagraph.com/pricing on 14 November 2026.
| Plan | Price | Credits | What it includes |
|---|---|---|---|
| Max | From US$812 a month, billed annually (shown as €699 in euros) | From 50 | Unlimited users and reports, blends and source groups, custom metrics, white-label branding, automated emails with PDF, linked report templates, KPI overviews with alerts, IQ Agents, managed MCP and a dedicated customer success manager |
| Prime | Custom quote, billed annually | Custom | Everything in Max, plus premium integrations, transfer to Looker Studio, and add-ons for BigQuery transfer, the public API, a custom report domain and SAML single sign-on, with priority support and tailored onboarding |
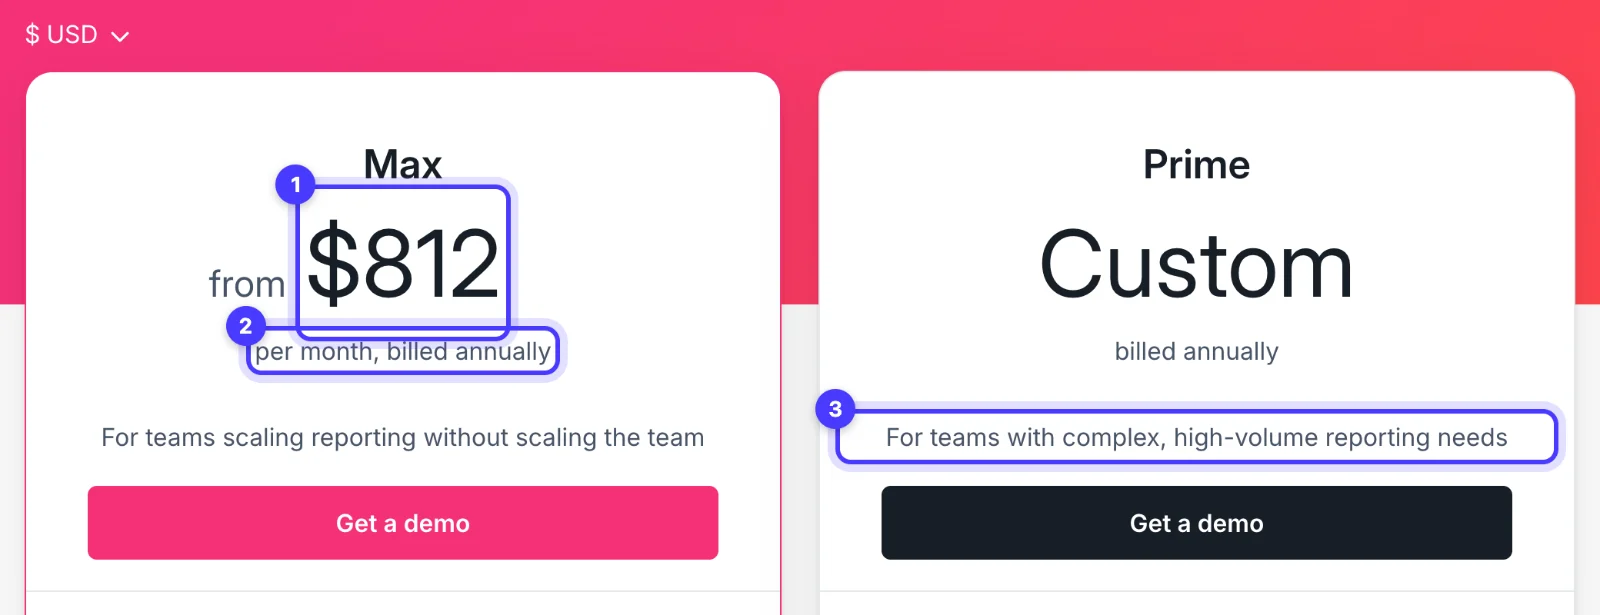
At the Reserve Bank's rate of US$0.6804 to the Australian dollar on 13 November 2026, US$812 a month is about A$1,193, and a year is US$9,744 (about A$14,321).
What a credit is
One credit is one connected data account, such as one Facebook Ads account or one GA4 property. Each source costs one credit on either plan, and you can buy extra credits up to the next plan threshold. The pricing page does not list a price for extra credits, so get that figure in writing before you sign.
Worked example: an agency with 15 ecommerce clients, each running Meta, Google Ads and GA4, uses 45 credits. Add Search Console for five SEO clients and it reaches 50. At US$812 a month, that is about US$54 (A$80) per client per month. A single brand with the same three sources uses 3 credits and still pays the US$812 floor, which is why we point single brands elsewhere.
The referral trial
Whatagraph's own pricing page sends you to a demo call. Our Whatagraph referral page lets you start a free trial yourself, with 30% off your first three months if you subscribe. Build one real client report during the trial, using the plan below, and you will know whether it earns its price.

Where Whatagraph falls short
- Price and plan gates. From US$812 a month is agency money. Max has no public API, no BigQuery or Looker Studio transfer and no custom report domain: those sit on Prime. Login on Max is Google only.
- MCP rate limits. Bursts of more than about eight calls get rate-limited with 25 to 60 second back-offs, so we run three to five agents at a time. Responses cap at about 50 KB, so large reads have to be paged. Ad-level reads can take over two minutes, Meta sometimes answers "data not ready", and a 90-day creative report can fail where 60 days works.
- Source group ratios. A group's built-in ratio fields add up per-account ratios, which gives the wrong answer for a portfolio. Build spend-weighted formulas instead. Duplicated groups also re-download quietly.
- Platform quirks that look like data. Google's search impression share shows 9.99 when the real figure is below 10%. Cost-per-result charts show $0 on days with no conversions. Google's conversion count changes when the client changes which actions count.
- Dates and caching. The share panel's "Update link" button resets the share's dates. The monthly date preset runs on UTC, so a new completed day lands around 11am Melbourne time. Google Sheets sources are cached, GA4 backfills take hours, and a blank embed usually needs a hard reload.
- Housekeeping. A connected source cannot be renamed. Restoring a report version gives every widget a new ID.
- Search Console gaps. OR conditions inside one filter group are ignored, and the connector does not expose Google's AI features report.
- No attribution model. Cohorts, lifetime value and incrementality are not native, and Shopify books 100% margin where product cost is blank. Whatagraph shows what each platform reports. It does not settle why Meta, GA4 and your store disagree: our guide to why marketing revenue reports disagree covers that.
We work around every one of these, and they are the reason each tile gets checked against the platforms before a report goes out.
See the decisions behind real ads.
46 ad breakdowns and 17 landing pages, each with the next test it suggests.
Set up a first useful report in a day
- Hour 1: start the trial and connect three sources. Sign up through the Whatagraph trial page with a Google account. Connect one Meta ad account, one Google Ads account and one GA4 property, and match each by account ID and currency before you build anything.
- Hour 2: build the Snapshot tab. One full-width table with a row per channel: Total, Meta, Google. Columns for ad revenue, ad spend, ROAS and CAC. Keep tables full width, because half-width tables clip values.
- Hour 3: create the MER blend. Blend Meta spend and Google spend with GA4 revenue, add a formula metric for GA4 revenue divided by total spend, and label it "MER (GA4 revenue / ad spend)". Put it on the Total row in place of ROAS.
- Hour 4: add a tab per channel. Campaign tables for Meta and for Google with spend, results, cost per result and ROAS. Our guides to the Meta ads report and the Google Ads report list the columns we use.
- Hour 5: check every tile. Open Ads Manager, Google Ads and GA4 for the same dates and compare spend, conversions and revenue tile by tile. Spend should match. Revenue will differ between platforms, and the MER caption should say it is GA4 revenue.
- Hour 6: set the dates, then share. A rolling last 30 days against the same period last year suits a live dashboard. Create the share link after the dates are final, because the link keeps its own range and "Update link" resets it. Leave explainer text boxes out of the report: put caveats in your message to the client.
- Hour 7: schedule delivery. Copy the dashboard for the monthly report, set an automated email for the 1st with the PDF attached, and send a test to yourself first.
Our monthly marketing report guide covers what to write alongside the PDF. If you would rather we built the report and ran the ads it reports on, tell us about your business.
Questions we get about Whatagraph
What is Whatagraph?
Whatagraph is a marketing reporting platform. It connects ad platforms, analytics and other sources, then builds live dashboards and scheduled, white-label PDF reports. Agencies use it to report on many client accounts from shared templates, and it has an MCP connector for Claude and ChatGPT.
How much does Whatagraph cost?
The Max plan starts at US$812 a month, billed annually, with 50 or more credits. Prime is priced by quote. One credit is one connected data account. At the Reserve Bank rate on 13 November 2026, US$812 is about A$1,193.
Does Whatagraph have a free trial?
Whatagraph's pricing page offers a demo call. Our referral link opens a page where you start a free trial yourself, with no call, and sign up with a Google account.
Is Whatagraph worth it?
For an agency or multi-account team reporting on roughly 15 or more clients, yes: templates, blends, scheduled white-label PDFs and the MCP save hours every month. For a single brand with one Meta and one Google Ads account, Ads Manager, Google Ads reports and GA4 or a free dashboard tool are enough.
What is a credit in Whatagraph?
A credit is one connected data account, such as one Facebook Ads account or one GA4 property. A client on Meta, Google Ads and GA4 uses three credits. Extra credits can be bought up to the next plan threshold.
Does Whatagraph work with Claude?
Yes. Whatagraph is in Claude's connector directory: open Settings, then Connectors, search for Whatagraph, connect and choose your team. Reading data works on every plan, and creating or changing reports depends on your plan.
Sources
- Whatagraph: Pricing
- Whatagraph: Integrations
- Whatagraph Help Center: Connect Whatagraph to your AI assistant with MCP
- Whatagraph: MCP
- Reserve Bank of Australia: Exchange rates
Disclosure: Hey Sage uses Whatagraph for client reporting and earns a referral fee when you subscribe through our Whatagraph links.