
On this page
- 01 · What a useful Meta ads report contains
- 02 · Build it free in Meta Ads Reporting
- 03 · The columns and breakdowns we would put in it
- 04 · How to read it as an owner: a worked example
- 05 · Why Meta's revenue will not match your store
- 06 · When you need more than Ads Manager
- 07 · Questions we get about Meta ads reports
- 08 · Sources
What a useful Meta ads report contains
A useful Meta ads report answers one question first: what did we spend, and what did it bring back? That means amount spent, purchases, cost per purchase, purchase value and ROAS for the month, set against the month before and the same month last year. Under that sit the numbers that explain the change: CPM, link click-through rate and frequency, by campaign and then by ad.
The fastest way to make one costs nothing. Open Ads Reporting in Meta Ads Manager, start from a template, set the columns and breakdowns in this guide, save it and switch on the scheduled email. Build it once and it arrives on its own.
You need more than Ads Manager when the report has to show Meta beside Google Ads and your store's revenue, when you report on many ad accounts, or when a client expects a branded PDF on the 1st of every month. That is where we use Whatagraph, and the last section covers how.
Build it free in Meta Ads Reporting
Ads Reporting is the report builder inside Ads Manager. Meta describes it as the place to create, customise, share, export and schedule reports on your campaign, ad set and ad results. You need admin, advertiser or analyst access to the ad account to schedule one.
- Open it. Choose Ads Reporting from the Ads Manager menu, or open the Export drop-down above the campaigns table and choose Create custom report.
- Start from a template. The panel on the right lists templates, including Commonly used performance metrics, ROI snapshot, Reach and frequency, and Engagement. Pick the closest one and pin it if you will reuse it.
- Choose a layout. Ads Reporting offers a pivot table, a trend chart or a bar chart. A pivot table is the right base for a monthly report: campaigns or ads down the side, metrics across the top.
- Set metrics and breakdowns. In the side panel, Metrics sets the columns and Breakdowns sets the rows: campaign, ad set, ad, time, age, gender and more. Filters work the same way as in Ads Manager, so you can limit the report to your sales campaigns.
- Add a custom metric if you need one. Ads Reporting lets you build a formula from existing metrics and save it under a name. We would add ROAS ex GST: purchases conversion value divided by 1.1, divided by amount spent. If you make a custom metric reusable, anyone with access to the ad account can use it and the formula can no longer be edited.
- Save and schedule it. Save the report. To have it emailed, open the report settings (the cog icon, or the link under the report name, depending on your version), turn on schedule email, add the people who should get it, apply and save. For a new report, choose Save as, name it and tick Schedule email.
How to export a Meta ads report
Select the export icon and choose XLSX (formatted data), XLSX (raw data), CSV or PNG. Choose CSV when the numbers are going into a spreadsheet beside your store's sales, and formatted XLSX when someone will only read it. A share link is the other route, but it opens only for people who already have access to the ad account. A business partner without access needs the file.
Limits worth knowing
- Cross-account reports (Create report, then choose several ad accounts) hold up to 24 months of data but cannot be scheduled for email.
- In the main Ads Manager table you can combine one breakdown from each of Meta's groups (By delivery, By action, By time) but never two from the same group.
- To compare two periods in the main Ads Manager table, open the date filter, switch on Compare and pick both ranges. The table then shows each range, the change and the percentage change.

Run Better Ads. The free guide + vault.
137 pages on ecommerce ads, with 46 real ads and 17 landing pages taken apart.
The columns and breakdowns we would put in it
Keep it to one table per level: campaigns first, then ads. These eight columns cover what an owner needs.
| Metric | Why it matters | The question to ask |
|---|---|---|
| Amount spent | The cost side of every other number. | Did we spend what we planned, and where did any extra go? |
| Purchases | Orders Meta credits to the ads under your attribution setting. | Does the trend match the trend in store orders? |
| Cost per purchase | What one credited order cost. | Is it below what an order earns us after product cost, shipping and fees? |
| Purchases conversion value | Revenue Meta credits to the ads, usually including GST. | How much of this would we have sold anyway? |
| Purchase ROAS | Purchases conversion value divided by amount spent. | Does it clear our break-even ROAS once GST is taken out? |
| CPM | Cost per 1,000 impressions: what the auction charged to reach people. | Did it rise with the season, or because the audience got narrower? |
| CTR (link click-through rate) | Link clicks divided by impressions: whether the ad earns a click. | Which ads are pulling the average down? |
| Frequency | The average number of times each person saw the ad. | Are we showing the same ads to the same people too often? |
Add Link clicks as a ninth column so you can work out the click-to-purchase rate: purchases divided by link clicks. That one number separates an ad problem from a website problem, as the example below shows.
For breakdowns, put campaign in the rows of the first table and month in the columns. The second table is the same layout by ad, which is where tired creative shows up. Age, gender and placement are worth a look each quarter rather than each month.
What counts as good depends on your margin and price point, so the comparisons that matter are your own last year and your break-even ROAS. For outside reference points, our Australian ecommerce ad benchmarks index holds public reference ranges converted to AUD.
How to read it as an owner: a worked example
Read the report in the order the money moves: spend, then purchases, then cost per purchase and ROAS. Only then look at CPM, CTR and frequency to find out why. Here is an invented month for Example Store, a homewares brand running sales campaigns on 7-day click and 1-day view attribution.
| Metric | September | October | Change |
|---|---|---|---|
| Amount spent | $7,000 | $8,000 | Up 14% |
| Purchases | 155 | 121 | Down 22% |
| Cost per purchase | $45.16 | $66.12 | Up 46% |
| Purchases conversion value | $23,250 | $18,150 | Down 22% |
| Purchase ROAS | 3.32 | 2.27 | Down 1.05 |
| CPM | $14.00 | $16.00 | Up 14% |
| Link clicks | 7,000 | 5,500 | Down 21% |
| CTR (link click-through rate) | 1.40% | 1.10% | Down 0.3 points |
| Frequency | 2.0 | 3.1 | Up 1.1 |
- Spend up, purchases down. Spend rose 14% and purchases fell 22%, so each purchase cost 46% more. ROAS fell from 3.32 to 2.27. Divide by 1.1 to take GST out and October's ROAS is 2.06.
- Check the website before you blame the ads. 155 purchases from 7,000 link clicks is 2.2%, and so is 121 from 5,500. The people who clicked bought at the same rate in both months, so the site and the offer held up.
- Find the cause. Both months bought about 500,000 impressions ($7,000 at a $14 CPM, $8,000 at $16). From the same impressions came fewer clicks: CTR fell from 1.40% to 1.10% while frequency rose from 2.0 to 3.1. The same people saw the same ads more often and stopped clicking. Each impression also cost 14% more.
- Act on it. The fix is new creative for the ad sets with the highest frequency, not a new website and not a bigger budget. Our guide to Meta ads frequency covers the levels worth acting on.
Two settings change what these numbers mean. The attribution setting decides which purchases Meta counts: our guide to the Meta attribution setting explains why we judge profit on the 7-day click column. And the pixel usually sends purchase values including GST, so compare ROAS with your break-even ROAS only after dividing by 1.1.
If the numbers do not point to an obvious cause, our free Meta ads performance doctor takes the same metrics and names the likely bottleneck. If you would rather hand the ads and the monthly read to someone, that is the work we do for Australian brands: tell us about yours.
Why Meta's revenue will not match your store
Meta's purchase value will almost never equal what Shopify or GA4 shows for the same month. On the default 7-day click, 1-day view setting, Meta counts a purchase within 7 days of a click or 1 day of a view, including people who saw an ad and never clicked. GA4 only sees visits to your site and shares the credit across channels. Your store counts orders, whoever gets the credit. Google Ads claims some of the same orders as well.
Two rules follow from that:
- Watch the gap, not the totals. A steady gap between Meta and the store is normal counting. A sudden change is either a tracking fault or a jump in view-through credit. The attribution gap diagnostic helps you tell which.
- Never add Meta's revenue to Google's to get a total. Meta's reported purchases include view-through conversions and overlap with the sales GA4 and Google Ads also claim. In our client reports the total row uses a different measure, total ad spend against GA4 revenue, which we label MER. Our guide to MER vs ROAS explains why.
For the full reconciliation, platform by platform, read why marketing revenue reports disagree.
See the decisions behind real ads.
46 ad breakdowns and 17 landing pages, each with the next test it suggests.
When you need more than Ads Manager
For one brand that runs only Meta, with an owner who can log in to Ads Manager, the free report above does the job. We would not pay for a reporting tool in that position.
Ads Reporting runs out in three places:
- More than one channel. It only knows Meta. Once Google Ads and GA4 matter, someone ends up copying numbers into a spreadsheet each month. Our monthly marketing report guide covers the cross-channel version, and the Google Ads report guide covers the Google side.
- Many accounts. Cross-account reports cannot be emailed on a schedule, so an agency or a group with several brands is back to exporting files by hand.
- Readers without access. Share links only open for people with access to the ad account. A client who expects a branded PDF on the 1st needs a reporting tool.
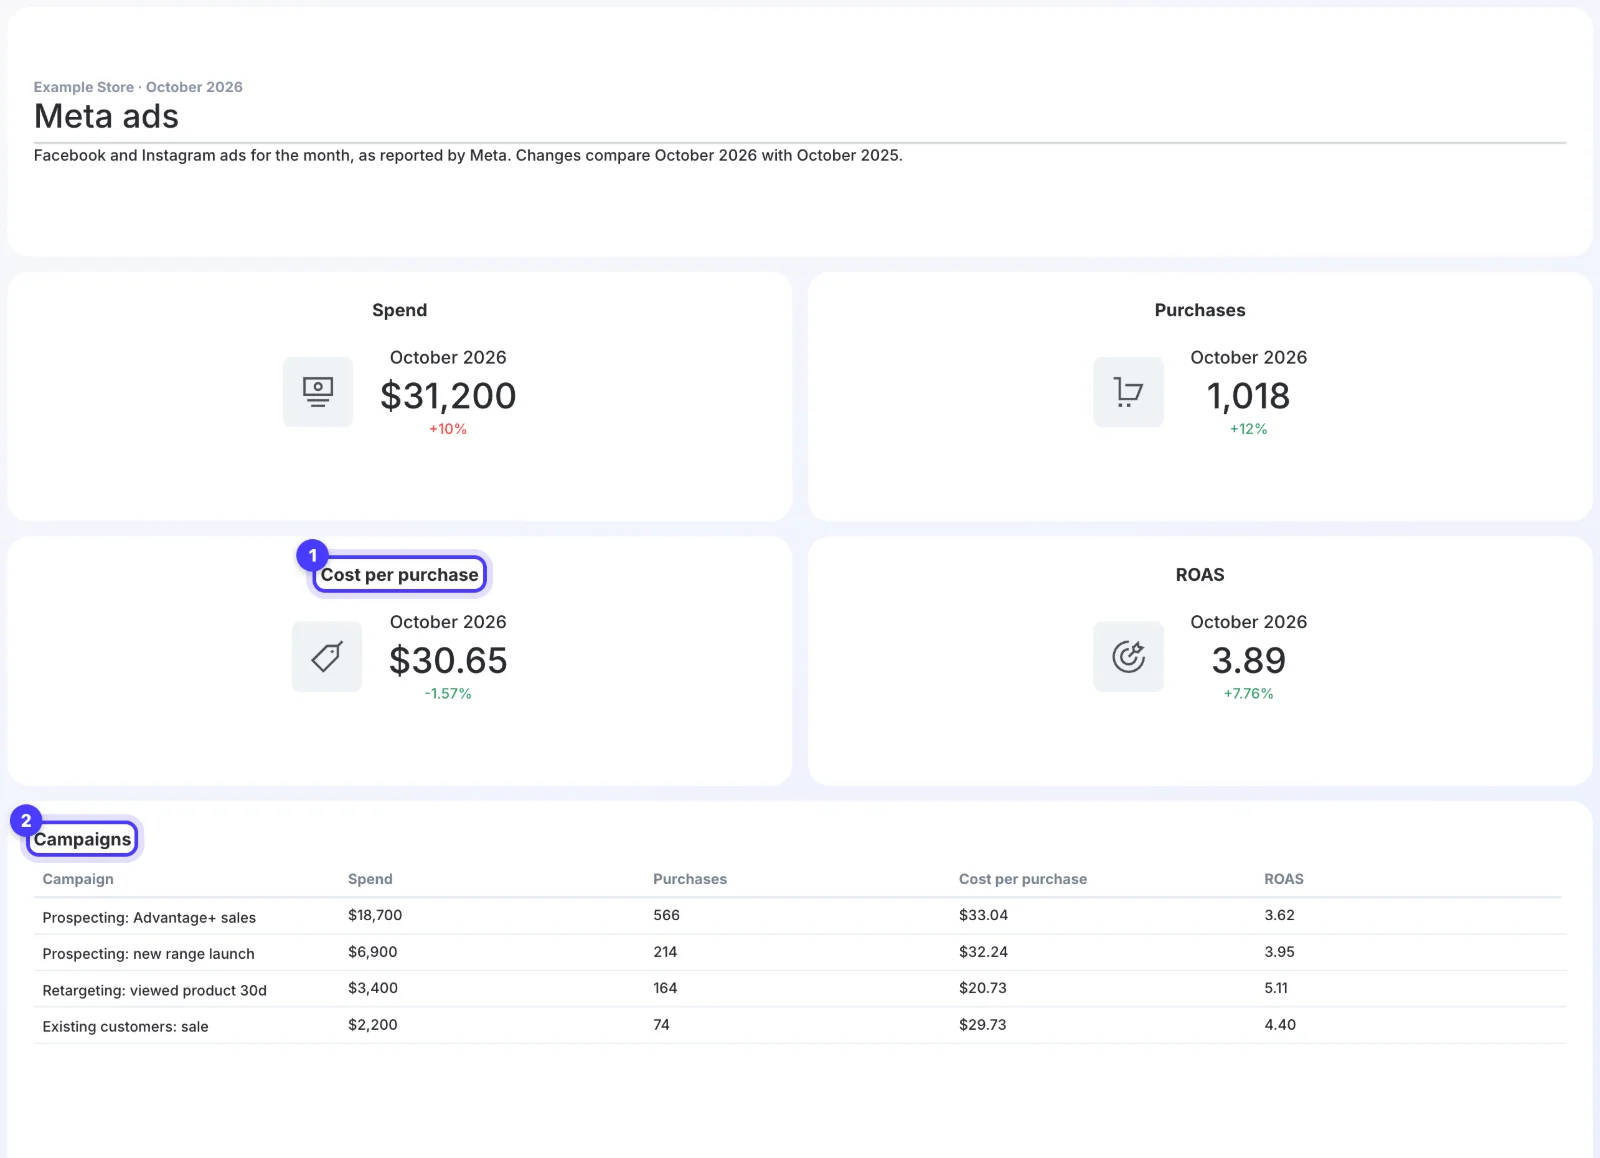
That is the job Whatagraph does for us. Around 40 live client dashboards run on it, each built on Meta Ads, Google Ads and GA4. Meta gets two of the seven tabs in our master ecommerce template, Meta ads and Meta ads creative, plus a row on the Snapshot tab with Meta's ad revenue, ad spend, ROAS and CAC, sitting under a Total row that shows MER. Dashboards refresh every 4 hours and show a rolling last 30 days against the same period last year. Monthly reports go out by email on the 1st with the PDF attached, under our branding with Whatagraph's own header and footer switched off. Before a new client report is shared, we check every tile against the raw platform data.
The limits are real. It is priced for agencies, from US$812 a month billed annually, and each connected ad account uses one credit. A cost-per-result chart shows $0 on a day with no conversions: that means no sales, not free sales. And it reports whatever Meta sends, so the attribution and GST points above still apply. Our Whatagraph review covers the rest from daily use. If you report on several brands or clients, our link gives you a free Whatagraph trial with 30% off the first three months.
Questions we get about Meta ads reports
How do I create a Meta ads report?
In Meta Ads Manager, open Ads Reporting, or open the Export drop-down and choose Create custom report. Start from a template, choose a pivot table, set the metrics and breakdowns, and save it. Turn on schedule email in the report settings to have it sent to you automatically.
How do I export a Meta ads report to Excel or CSV?
In Ads Reporting, select the export icon and choose XLSX (formatted data), XLSX (raw data), CSV or PNG. A share link only opens for people with access to the ad account, so send the file to anyone without access.
Can Meta email a report automatically?
Yes. Open the report settings in Ads Reporting, turn on schedule email, add the recipients and save. You need admin, advertiser or analyst access to the ad account, and cross-account reports cannot be scheduled.
What should a monthly Meta ads report include?
Amount spent, purchases, cost per purchase, purchases conversion value and ROAS against last month and the same month last year, then CPM, link click-through rate, frequency and link clicks by campaign and by ad. Judge profit on the 7-day click figure with GST removed.
Why does Meta show more revenue than Shopify?
Meta counts purchases within 7 days of a click or 1 day of a view, including people who never clicked, and its purchase value usually includes GST. Shopify counts orders. A steady gap is normal; watch for the gap changing.
Is there a free Meta ads report template?
Ads Reporting has free templates, including Commonly used performance metrics, ROI snapshot and Reach and frequency. Start from one and swap in the eight columns in this guide plus link clicks.
Sources
- Meta Business Help Centre: About Meta Ads Reporting
- Meta Business Help Centre: Create a report using templates in Ads Reporting
- Meta Business Help Centre: Run a recurring report and send it to different email addresses in Ads Reporting
- Meta Business Help Centre: Create a visualisation in Ads Reporting
- Meta Business Help Centre: Create custom metrics in ads reporting
- Meta Business Help Centre: Create cross-account reports in ads reporting
- Meta Business Help Centre: Navigate to breakdowns in Ads Manager
- Meta Business Help Centre: View results on ad performance across different date ranges
- Meta Business Help Centre: Purchases ROAS (return on ad spend)
- Meta Business Help Centre: CTR (link click-through rate)
- Whatagraph: Pricing
- Whatagraph: Facebook Ads integration
Disclosure: Hey Sage uses Whatagraph for client reporting and earns a referral fee when you subscribe through our Whatagraph links.