
On this page
- 01 · What a useful Google Ads report contains
- 02 · Build it free in Report editor
- 03 · What to include for Search, Performance Max and Shopping
- 04 · Performance Max: what the report can show
- 05 · How to read it: a worked example and two traps
- 06 · Where Google sits in the total
- 07 · When Whatagraph earns its place
- 08 · Questions we get about Google Ads reports
- 09 · Sources
What a useful Google Ads report contains
A useful Google Ads report shows cost, conversions, conversion value, cost per conversion and ROAS by campaign for the month, against the month before and the same month last year. Then it shows why the numbers moved: which searches spent the money, how much demand you missed through budget or ad rank, and which conversion actions were counted. For Performance Max, add the split by channel.
The fastest way to make one is free inside Google Ads. Build it in Report editor, save it and schedule it to arrive by email. Every table in the account also downloads as a spreadsheet, a PDF or a Google Sheet.
Once Google has to sit beside Meta and your store's revenue, or you report on many accounts, a reporting tool earns its place. We use Whatagraph for that, and the last section covers how.
Build it free in Report editor
- Open Report editor. Select the Campaigns icon, then Insights and reports, then Report editor.
- Start from a predefined report or a blank one. Predefined reports (dimensions) are ready-made tables: open one, add or remove columns and save your own copy. For a blank report choose Custom, then Table, Line, Column, Bar, Scatter or Pie.
- Drag in rows and columns. Drag a dimension such as Campaign into the rows and metrics such as Cost, Conversions and Conv. value into the columns. The filter icon above the table narrows it, for example to one campaign type.
- Set the date range with the selector in the upper right of the page.
- Save it. Select Save, or Save as for a copy under a new name. Saved reports sit on the Insights and reports page, and everyone with access to the account can see them.
- Schedule it. Open the saved report, select the email and schedule icon, choose the account users who should receive it, a frequency such as daily or weekly, and a format (.csv or .xml), then save. Scheduled reports run at 3 am in the account's time zone.
Download any table
Every statistics table in Google Ads has a download icon above it. Download offers Excel CSV, TSV, PDF, XLSX, XML and Google Sheets, and Schedule sends the same table on a repeat, as a CSV or a PDF. For a one-off this is the quickest route: set up the campaigns table with the columns below, pick last month, download.
Limits worth knowing
- Scheduled reports go to users of the Google Ads account, so an owner without access cannot be on the list.
- Report editor schedules .csv or .xml files, which suit a spreadsheet and not a reader. If the owner wants something to read, schedule the campaigns table as a PDF instead.
- Saved reports you have not opened in 18 months are removed automatically.

Run Better Ads. The free guide + vault.
137 pages on ecommerce ads, with 46 real ads and 17 landing pages taken apart.
What to include for Search, Performance Max and Shopping
These are the reports we would put in a monthly Google Ads report for an ecommerce account. The first row is the summary; each row after it answers one question.
| Report | Where to find it | The question it answers |
|---|---|---|
| Campaign summary: Cost, Conversions, Conv. value, Cost / conv., Conv. value / cost | The campaigns table, or a Report editor table with Campaign as rows | Which campaigns earn their cost? |
| Brand and non-brand split | Separate brand and non-brand Search campaigns, then the same summary | How much of the result came from people who already searched for us by name? |
| Search terms | Insights and reports, then Search terms | Which searches spent money without converting, and which deserve their own keyword? |
| Impression share | Columns, then Competitive metrics: Search impr. share, Search lost IS (budget), Search lost IS (rank) | Are we missing demand because the budget ran out, or because our ads lost the auction? |
| Conversions by conversion action | Segment the campaigns table by conversion action | Is every counted action a real sale or lead? |
| Performance Max channels | Insights and reports, then Channel performance | How much went to Search and Shopping, and how much to YouTube, Display and the rest? |
| Performance Max search terms | Search terms report, view: Search terms and landing pages for Performance Max | What were people searching when our Shopping or text ads showed? |
| Shopping impression share | Campaigns, Ad groups or Product groups pages | Which product groups lose the most auctions? |
Conv. value / cost is Google's ROAS column: total conversion value divided by total cost. Cost / conv. is cost divided by Conversions. Keep the report to two pages, a summary table by campaign and then one table per question. If the campaign list itself is hard to read, the report will be too: our Google Ads account structure builder lays out Search, Shopping and Performance Max for an ecommerce catalogue.
Performance Max: what the report can show
Two reports now cover most of what owners want to know about Performance Max.
- Channel performance splits a campaign across Google Search, the Display Network, YouTube, Discover, Maps, Gmail and Search partners. It shows impressions, clicks, conversions, conversion value and cost by channel, a Status column for problems, and segments for channel, ads using product data, ads using video and conversion action. It covers Performance Max and Demand Gen only, dates before 6 June 2025 are not available, and the table can be downloaded.
- Search terms and landing pages for Performance Max, a view inside the Search terms report, lists the searches that triggered your ads with the landing page and ad format (Shopping ads or text ads). Data starts in March 2023, and store visits and store sales are left out.
Read the channel split as information, not a verdict. A channel with little spend is usually the system favouring channels it predicts will return more, so check the Status column before calling it a fault. Google also says to weight conversions above clicks and impressions for Performance Max, because some conversions follow a view rather than a click. If you are still choosing campaign types, our guide to Performance Max vs Demand Gen covers when each one fits.
How to read it: a worked example and two traps
Read it in the order the money moves: cost, conversions, conversion value, then ROAS. Then use impression share and search terms to find out why. Here is an invented month for Example Store, a homewares brand.
| Campaign | Cost | Conversions | Conv. value | Cost / conv. | Conv. value / cost | Search impr. share |
|---|---|---|---|---|---|---|
| Search: brand | $600 | 60 | $9,000 | $10.00 | 15.00 | 92% |
| Search: non-brand | $2,400 | 40 | $6,000 | $60.00 | 2.50 | 9.99% |
| Performance Max | $5,000 | 100 | $16,000 | $50.00 | 3.20 | Not shown |
| Total | $8,000 | 200 | $31,000 | $40.00 | 3.88 |
- Take brand out. The account shows 3.88, but brand search returns 15.00 from people who already typed the store's name. Without it the account returns $22,000 from $7,400, a ROAS of 2.97. If your conversion values include GST, divide by 1.1: 2.70. That is the number to hold against your break-even ROAS.
- Read impression share with lost IS. Non-brand Search shows 9.99%, with Search lost IS (budget) at 62% and Search lost IS (rank) at 30%. The campaign is starved: it shows for a small slice of the searches it qualifies for, mostly because the budget runs out. Before adding budget, open the search terms report and cut the searches that spend without converting.
- Check what was counted. Segment conversions by conversion action. Every action in the Conversions column should be a purchase or a real lead.
Trap 1: 9.99% means under 10%
In Whatagraph, a Search impression share below 10% shows as 9.99%. It is a placeholder, not a measurement. Google's API reports any search impression share below 10% as 0.0999, and any lost impression share above 90% as 0.9001. Google Ads' own custom columns show the same 0.0999, or a blank. So 9.99% last month and 9.99% this month can hide a fall from 9% to 3%. Never average it into a total. Read the two lost IS columns instead: they tell you whether budget or ad rank is the reason.
Trap 2: conversions change when the counted actions change
Only primary conversion actions appear in the Conversions and Conv. value columns. Secondary actions appear only in All conv. So if someone makes a secondary action primary, switches the purchase tag to secondary or changes the account's goals, the Conversions column moves with no change in sales. GA4 conversions created from Google Analytics start as secondary and can only be made primary in Google Ads, and changes made from the GA4 side show up only in Google Ads' Change history.
Before you compare months, segment both by conversion action and check the list matches. If it does not, compare only the actions that stayed the same. View-through conversions never appear in Conversions either, only in View-through conversions and All conv., which is one reason Google and Meta count so differently. If you would rather someone ran these checks every month, that is the work we do for Australian brands: tell us about yours.
See the decisions behind real ads.
46 ad breakdowns and 17 landing pages, each with the next test it suggests.
Where Google sits in the total
Google's conversion value will not match GA4 or your store, and it overlaps with what Meta claims. That is why our client reports never add the channel revenue rows together. The total row uses total ad spend against GA4 revenue, which we label MER, and each channel row keeps its own ROAS. Our guide to MER vs ROAS explains the difference, and why marketing revenue reports disagree walks through reconciling the platforms.
When Whatagraph earns its place
If you run Google Ads for one brand and the owner logs in, Report editor and a scheduled campaigns table are enough. Pay for a reporting tool when one of these is true:
- The report has to show Google beside Meta and GA4 revenue on one page. Our monthly marketing report guide covers that layout, and the Meta ads report guide covers the Meta side.
- You report on many accounts and each one has to go out on time without exporting by hand.
- The reader has no access to Google Ads, so scheduled reports cannot reach them.
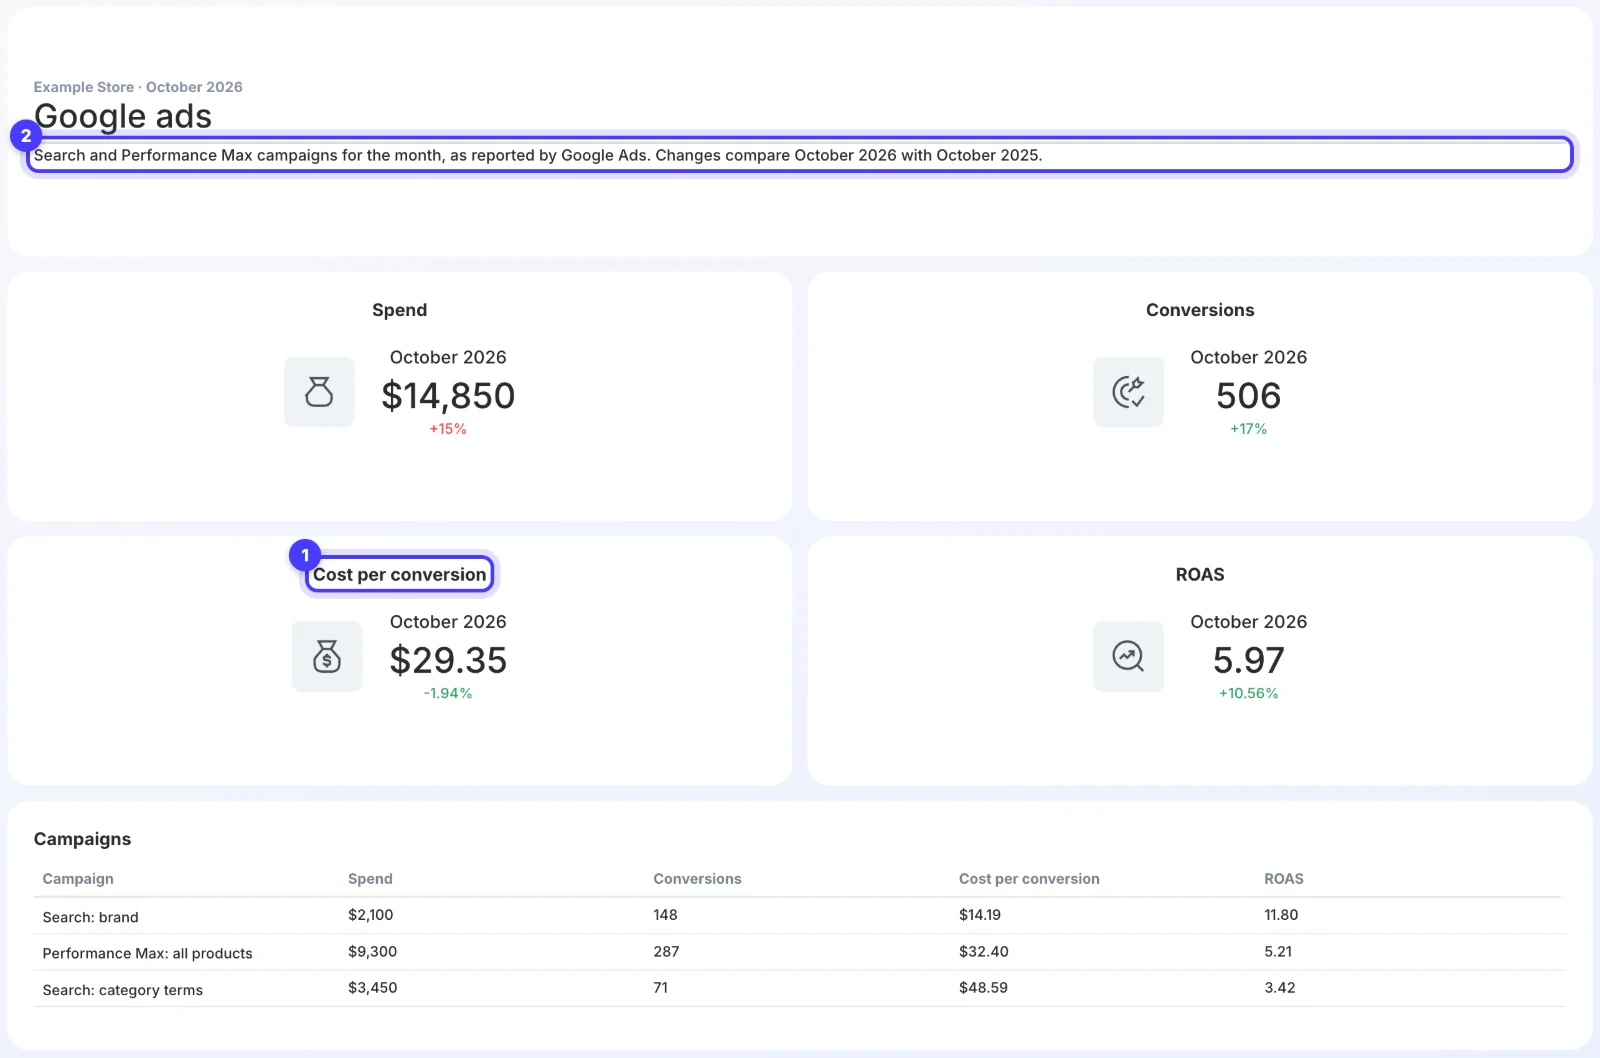
For us that tool is Whatagraph. Every client report we run is built on Meta Ads, Google Ads and GA4, across around 40 live dashboards. Google has its own tab, Google ads, in our master ecommerce template, and its own row on the Snapshot tab with Google's logo, ad revenue, ad spend, ROAS and CAC. The first row on that tab is Total, which shows MER (GA4 revenue against Meta plus Google spend) instead of ROAS. Monthly reports go out by email on the 1st and weekly reports on Mondays, always with the PDF attached.
The limits: it is priced for agencies, from US$812 a month billed annually, and each connected ad account uses one credit. It shows the 9.99% placeholder described above, and cost-per-result charts show $0 on days with no conversions. It also cannot fix a conversion setup: if the account counts the wrong actions, the report repeats them faithfully. Through our link, the Whatagraph trial includes 30% off the first three months.
Questions we get about Google Ads reports
How do I create a custom report in Google Ads?
Select the Campaigns icon, then Insights and reports, then Report editor. Choose Custom, pick a table or chart, drag a dimension such as Campaign into the rows and metrics such as Cost and Conversions into the columns, set the date range and save.
Can Google Ads email a report automatically?
Yes, to users of the account. Open a saved report, select the email and schedule icon, choose the recipients, a frequency and a format, and save. Scheduled reports run at 3 am in the account's time zone.
What should a Google Ads monthly report include?
Cost, conversions, conversion value, cost per conversion and ROAS by campaign against last month and last year, then search terms, impression share with lost IS, conversions by conversion action and, for Performance Max, the channel performance report.
How do I download a Google Ads report?
Select the download icon above any statistics table and choose Excel CSV, TSV, PDF, XLSX, XML or Google Sheets. Saved Report editor reports download as .csv or .xml.
Why does my impression share show 9.99%?
Google's API reports any search impression share below 10% as 0.0999, so reporting tools that read it, Whatagraph included, show 9.99%. It means under 10%. Read Search lost IS (budget) and Search lost IS (rank) to see why.
Why did my Google Ads conversions change when sales did not?
Usually because the actions counted in the Conversions column changed. Only primary conversion actions appear there. Segment both months by conversion action and check Change history for the switch.
Sources
- Google Ads Help: Create custom reports in Report Editor
- Google Ads Help: Create and manage reports
- Google Ads Help: Create, save and schedule reports from your statistics tables
- Google Ads Help: About the search terms report
- Google Ads Help: Get impression share data
- Google Ads Help: About columns in custom columns
- Google Ads API: Metrics reference
- Google Ads Help: About primary and secondary conversion actions
- Google Ads Help: About 'All conversions'
- Google Ads Help: Conversion value per cost
- Google Ads Help: About the channel performance report for Performance Max
- Google Ads Help: About the search terms report in Performance Max
- Whatagraph: Pricing
- Whatagraph: Google Ads integration
Disclosure: Hey Sage uses Whatagraph for client reporting and earns a referral fee when you subscribe through our Whatagraph links.