
On this page
- 01 · MER vs ROAS: our definitions
- 02 · Blended ROAS vs MER: why the vendors disagree
- 03 · The formulas, worked through for Example Store
- 04 · GST: know which numbers include it
- 05 · Why platform ROAS rows add up to more than the store took
- 06 · Platform ROAS, MER and break-even: three jobs
- 07 · What a good MER is for your store
- 08 · When MER misleads
- 09 · How we set up the MER row in Whatagraph
- 10 · Questions we get about MER and ROAS
- 11 · Sources
MER vs ROAS: our definitions
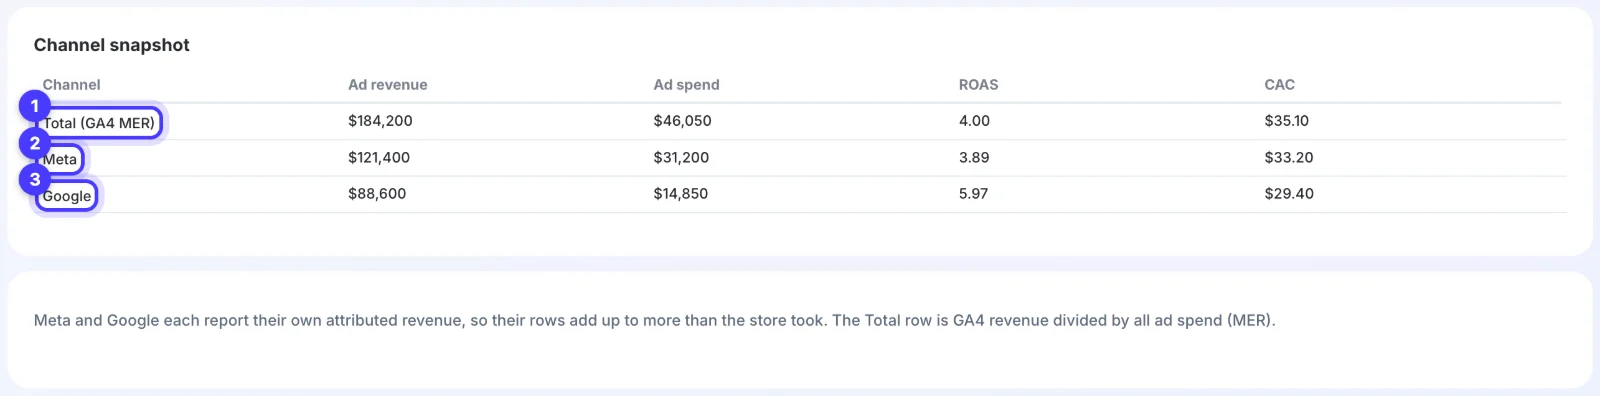
ROAS (return on ad spend) is the revenue one ad platform credits to its own ads, divided by what you spent on that platform. MER (marketing efficiency ratio) is your business's total revenue divided by your total ad spend. In our client reports MER is GA4 revenue divided by Meta plus Google ad spend. Use ROAS for decisions inside a channel and MER to judge whether the month paid off.
We never call MER "blended ROAS" in a client report. Vendors use "blended ROAS" for more than one formula, and a row labelled ROAS invites people to compare it with the channel rows or add them up. Our Total row reads "MER (GA4 revenue / ad spend)", so the formula travels with the number.
Blended ROAS vs MER: why the vendors disagree
Search "blended ROAS vs MER" and the analytics vendors give different answers:
| Source | Blended ROAS | MER |
|---|---|---|
| Polar Analytics | All revenue ÷ paid media spend | All revenue ÷ all marketing spend |
| Admetrics | Total shop revenue ÷ total ad spend, and "the terms are often used interchangeably" | Total revenue ÷ total marketing spend |
| BlueAlpha | "Sometimes limited to media spend" | Total revenue ÷ total marketing spend, "occasionally called blended ROAS" |
| Our reports | Not used | GA4 revenue ÷ (Meta spend + Google spend) |
By Polar's definitions, our MER is what they call blended ROAS. We keep the name MER for two reasons. The number is a business measure built from different data than the channel rows, and calling it ROAS hides that. And we leave agency fees, software and wages out of the spend on purpose: they do not change with each extra order, so they belong in your profit target, which is where the next sections put them. Whatever you call it, put the revenue source and the spend it covers in the label.

Run Better Ads. The free guide + vault.
137 pages on ecommerce ads, with 46 real ads and 17 landing pages taken apart.
The formulas, worked through for Example Store
Example Store is an invented Australian homewares brand on Shopify, advertising on Meta and Google. One month:
| Input | Figure |
|---|---|
| GA4 revenue | $184,200 |
| Meta spend / Meta-reported revenue | $31,200 / $121,400 |
| Google spend / Google-reported revenue | $14,850 / $88,600 |
| New customers | 1,312 |
- Meta ROAS = Meta-reported revenue ÷ Meta spend = $121,400 ÷ $31,200 = 3.89.
- Google ROAS = $88,600 ÷ $14,850 = 5.97. Google Ads shows this in the Conversion value/cost column.
- Total ad spend = $31,200 + $14,850 = $46,050.
- MER = GA4 revenue ÷ total ad spend = $184,200 ÷ $46,050 = 4.00.
- CAC = total ad spend ÷ new customers = $46,050 ÷ 1,312 = $35.10.
The common mistake is to add the platforms' revenue and divide by total spend: ($121,400 + $88,600) ÷ $46,050 = 4.56. That number is neither ROAS nor MER. It counts some orders twice and overstates the month by 14%.
To work it out for your own Shopify store: take total sales for the month from Shopify, or total revenue from GA4. Take Meta spend from Ads Manager and Google spend from Google Ads for the same dates. Add the two spends and divide. Keep all three numbers on one time zone and one GST basis.
GST: know which numbers include it
Most Australian stores show prices including 10% GST, so the question is which of your revenue figures keep it.
- Meta: Shopify's help centre says events that track an order value use the order's total price, including duties, taxes and discounts. Through Shopify's Meta integration, Meta's revenue includes GST.
- GA4 and Google Ads: Google's reference for tags loaded through the Google & YouTube app on Shopify says the purchase value takes off item and order discounts but does not include shipping or taxes.
- Anything custom: a store tagged through Google Tag Manager or a third-party app sends whatever it was built to send.
Going by those two pages, a store on the standard integrations has GST inside Meta's ROAS and outside its GA4 MER. If Example Store is set up that way, Meta's revenue before GST is $121,400 ÷ 1.1 = $110,364, and Meta's ROAS on the same basis as the MER is 3.54, not 3.89. Check yours with one test order: compare the order total in Shopify with the value Meta and GA4 record for it.
Then pick one basis for the whole report and say it in the label. Before GST is cleaner, because it is the money you keep. Compare a before-GST MER with a before-GST break-even.
Why platform ROAS rows add up to more than the store took
In the example, Meta and Google claim $210,000 between them and GA4 recorded $184,200. That gap is normal:
- View-through credit. When an ad set's attribution setting includes 1-day view, Meta counts purchases by people who saw the ad, did not click and bought within a day. GA4 never sees those views. Our Meta attribution setting guide covers each window.
- Overlap. A customer clicks a Meta ad on Monday, searches your brand on Google on Thursday and buys. Both platforms can claim the order.
- Different rules. Each platform counts inside its own windows and model, while GA4 shares credit across every channel in the path, including email and organic search.
Compare platform claims, GA4 and actual orders in one place
Put four rows in one table for the same dates, time zone and GST basis:
| Row | What it counts | What a change in its ratio to the store means |
|---|---|---|
| Store orders (Shopify) | Every order and its value | This is the base the others are divided by |
| GA4 | Orders its tag recorded on the site | Falling: a tracking problem, such as a tag that stopped firing |
| Meta's claim | Orders Meta credits under your attribution setting | Rising while store sales stay flat: more credit, not more sales |
| Google's claim | Orders Google credits under its own model | Same reading as Meta |
Divide each row by the store row and track the ratios month by month. The gap itself is normal; a change in the gap is the signal. Our free attribution gap diagnostic lays out this comparison, and our guide to why marketing revenue reports disagree walks through reconciling them.
Platform ROAS, MER and break-even: three jobs
| Number | Use it for | Not for |
|---|---|---|
| Platform ROAS | Choosing between campaigns, ad sets and ads inside one platform, and setting that platform's bid targets | Adding up to a total, or judging the whole business |
| MER | Whether the month made money, and how much total budget the business can carry | Deciding which campaign to cut: it cannot see campaigns |
| Break-even | The floor each number has to clear, worked out from your margin | A target: break-even is zero profit |
Each platform's ROAS has its own break-even on its own GST basis, and the business has a break-even MER. Our break-even ROAS guide works out the platform figure, including the 1.1 adjustment when the platform's revenue includes GST.
What a good MER is for your store
A good MER leaves profit after ads and fixed costs, and only your margin can tell you where that is. We do not quote an industry MER benchmark, because MER moves with margin, repeat customers and how much of your revenue arrives without ads.
Work it out on the same GST basis as your revenue:
- Contribution margin: what is left of each dollar of revenue after product cost, freight, packing, payment fees and refunds. Say Example Store keeps 40 cents in the dollar before GST. Our COGS calculator works out yours.
- Break-even MER: 1 ÷ 0.40 = 2.50. Below that, the ads cost more than all the store's revenue contributes.
- MER that covers fixed costs: with $20,000 a month of rent, wages, software and fees, and $46,050 of ad spend, the store needs ($46,050 + $20,000) ÷ 0.40 = $165,125 of revenue. That is an MER of 3.59.
- Target MER: add the monthly profit you want to the fixed costs and run the same sum.
Example Store's month at 4.00: $184,200 × 0.40 = $73,680 of contribution, less $46,050 of ads and $20,000 of fixed costs, leaves $7,630 of profit.
Public benchmarks report platform ROAS and costs, not your MER. Our Australian ecommerce ad benchmarks page shows public reference ranges for context; your margin makes the decision.
See the decisions behind real ads.
46 ad breakdowns and 17 landing pages, each with the next test it suggests.
When MER misleads
- Big email or organic months. A strong email sale, a press mention or a seasonal peak lifts revenue without more ads. MER rises and the ads look better than they were. Read it next to the channel rows and the same month last year.
- Wholesale or marketplace orders in the revenue. If wholesale orders pass through your checkout, or you add marketplace sales to the figure, take them out. The ads did not earn them.
- Launches and sale periods. Spend often runs ahead of a launch, so the build-up month shows a low MER and the launch month a high one. Judge the two months together.
- Rising spend. MER is an average, and it can look healthy while the last few thousand dollars added little. If Example Store lifted spend from $40,000 to $46,050, revenue needed to rise by at least $6,050 × 2.50 = $15,125 for the extra spend to pay for itself.
- Tracking gaps. A GA4 tag that stops firing on part of checkout cuts revenue and MER with no change in sales. That is why our caption names GA4, and why the store's own figure is the final check.
How we set up the MER row in Whatagraph
In our reports MER is the Total row on the Snapshot tab, above the Meta and Google rows; our monthly marketing report template shows the full layout. We build it in Whatagraph in three parts:
- A blend of Meta spend and Google spend against GA4 revenue. In the app, blends live under Organize, then Aggregations: Create New, then Create a new blend, then pick the sources, metrics, join type and join key. Whatagraph's help centre warns that a blend inflates totals when one source is broken down further than the other, so keep both sides at the same level of detail.
- A formula metric: GA4 revenue ÷ (Meta spend + Google spend), set to Aggregate level. Whatagraph describes Aggregate level as aggregating the rows first and applying the formula once, on the total. Row level calculates the formula on each row first, which is the wrong sum for a monthly total.
- A label: "MER (GA4 revenue / ad spend)" or "Total GA4 MER", with a caption saying the revenue is GA4's.
Overall CAC is spend-weighted the same way: total spend over total new customers, calculated once. Example Store's Meta and Google rows show CACs of $33.20 and $29.40 by each platform's own count of new customers, both below the $35.10 total, because the platforms claim more new customers between them than the store recorded. Averaging the two rows would give $31.30. We never use a source group's built-in ratio fields for CAC either, because they add up each account's ratio, which is wrong for a portfolio.
If you only need MER once a month, a spreadsheet does it: three numbers and one division. Whatagraph is priced for agencies, from US$812 a month billed annually, and earns that when you report MER for many accounts on a schedule. Our link gives you a free trial and 30% off the first three months if you want to build the MER blend in Whatagraph yourself. If you would rather we set up the reporting and run the ads against it, tell us about your store.
Questions we get about MER and ROAS
Is blended ROAS the same as MER?
It depends who is talking. Some vendors use the terms interchangeably; others say blended ROAS divides revenue by ad spend and MER divides it by all marketing spend. In our reports MER is GA4 revenue divided by Meta plus Google ad spend, and we never call it blended ROAS.
How do I calculate blended ROAS across Meta and Google for my Shopify store?
Take total sales for the month from Shopify, or total revenue from GA4, and divide by Meta spend plus Google spend for the same dates. For example, $184,200 divided by ($31,200 + $14,850) is 4.00. Do not add Meta's and Google's reported revenue, and keep every figure on the same GST basis. We call this number MER.
How do I compare platform claims vs GA4 vs actual orders in one place?
Build one table with four rows, store orders, GA4, Meta's claim and Google's claim, for the same dates, time zone and GST basis. Divide each row by the store's figure and track those ratios every month. The gap is normal; a change in it is the signal. Our free attribution gap diagnostic sets this out for you.
What is a good MER?
One that clears your break-even after fixed costs. Break-even MER is 1 divided by your contribution margin, so a store keeping 40 cents in the dollar breaks even at 2.50. Add fixed costs and the profit you want to find your target. Industry averages tell you little, because margins differ.
Should MER include agency fees and software?
We leave them out. They do not change with each extra order, so they belong in the profit target that sets your MER goal. If you include them, say so in the label, because the number is then a different measure.
Is MER better than ROAS?
They do different jobs. ROAS ranks campaigns and ads inside one platform. MER tells you whether all the ads together paid for the business. A useful report shows both, with MER on the Total row.
Sources
- Polar Analytics: MER (Marketing Efficiency Ratio)
- Admetrics: MER vs ROAS
- BlueAlpha: MER vs ROAS
- Shopify Help Centre: Meta data sharing
- Google Tag Platform: Shopify event parameters for the Google & YouTube app
- Google Analytics Help: Dimensions and metrics
- Google Ads Help: About conversion values
- Whatagraph Help Center: Blended sources, building unified views from multiple data sources
- Whatagraph Help Center: Why are my blended metrics showing inflated numbers?
- Whatagraph Help Center: How to configure value types and aggregation for custom metrics
- Whatagraph: Pricing
Disclosure: Hey Sage uses Whatagraph for client reporting and earns a referral fee when you subscribe through our Whatagraph links.