
On this page
- 01 · What goes in a monthly marketing report, in order
- 02 · The Snapshot: one row per channel, and a Total row
- 03 · Worked example: one month for Example Store
- 04 · The rest of the template, tab by tab
- 05 · The written summary goes in the message
- 06 · Cadence: monthly on the 1st, weekly on Mondays
- 07 · Questions to ask of your monthly report
- 08 · The lead-gen version: spend, key events, cost per key event
- 09 · How we build it in Whatagraph
- 10 · Questions we get about monthly marketing reports
- 11 · Sources
What goes in a monthly marketing report, in order
A monthly marketing report for a business running Meta and Google ads opens with one Snapshot table: a row for each channel showing its ad revenue, ad spend, ROAS and customer acquisition cost (CAC), under a Total row that shows MER, your total GA4 revenue divided by your total ad spend. The detail follows in this order: website data, each ad channel, creative, audience, and SEO if you pay for SEO. The written part, what changed and what happens next, goes in the email that carries the report, not inside it.
That is the layout we run across around 40 live client dashboards. Below is each section, a worked example with the arithmetic, the cadence, the questions to ask of your own report and the version for lead generation businesses.
The Snapshot: one row per channel, and a Total row
The Snapshot is the first tab and the one most owners read. It answers one question: did the ads pay their way this month? Each row carries the channel's logo and four numbers.
| Column | Channel rows (Meta, Google, others) | Total row |
|---|---|---|
| Revenue | Revenue the platform credits to its own ads | Total GA4 revenue for the month |
| Ad spend | Spend on that platform | Meta spend plus Google spend |
| Efficiency | ROAS: channel revenue ÷ channel spend | MER: GA4 revenue ÷ total ad spend |
| CAC | Spend ÷ the platform's count of new customers | Total spend ÷ total new customers |
Three rules keep the table honest:
- The Total row shows MER, and names its revenue. We label it "MER (GA4 revenue / ad spend)" or "Total GA4 MER", never "blended ROAS", and the caption says GA4 because GA4 revenue differs from the store's own sales figure. Our guide to MER vs ROAS explains why the name matters.
- Channel revenue rows are never added together. Meta's reported purchases include view-through conversions, people who saw an ad, did not click and bought within a day, and many of those orders also sit in GA4 and in Google's count. Add the rows and some orders are counted twice. Our Meta attribution setting guide shows what Meta counts.
- CAC is left off a channel that cannot tell new customers from returning ones. A blank cell beats a CAC that quietly includes repeat buyers.
Spend can be added across rows, because it is money that left your account. Revenue claims cannot.

Run Better Ads. The free guide + vault.
137 pages on ecommerce ads, with 46 real ads and 17 landing pages taken apart.
Worked example: one month for Example Store
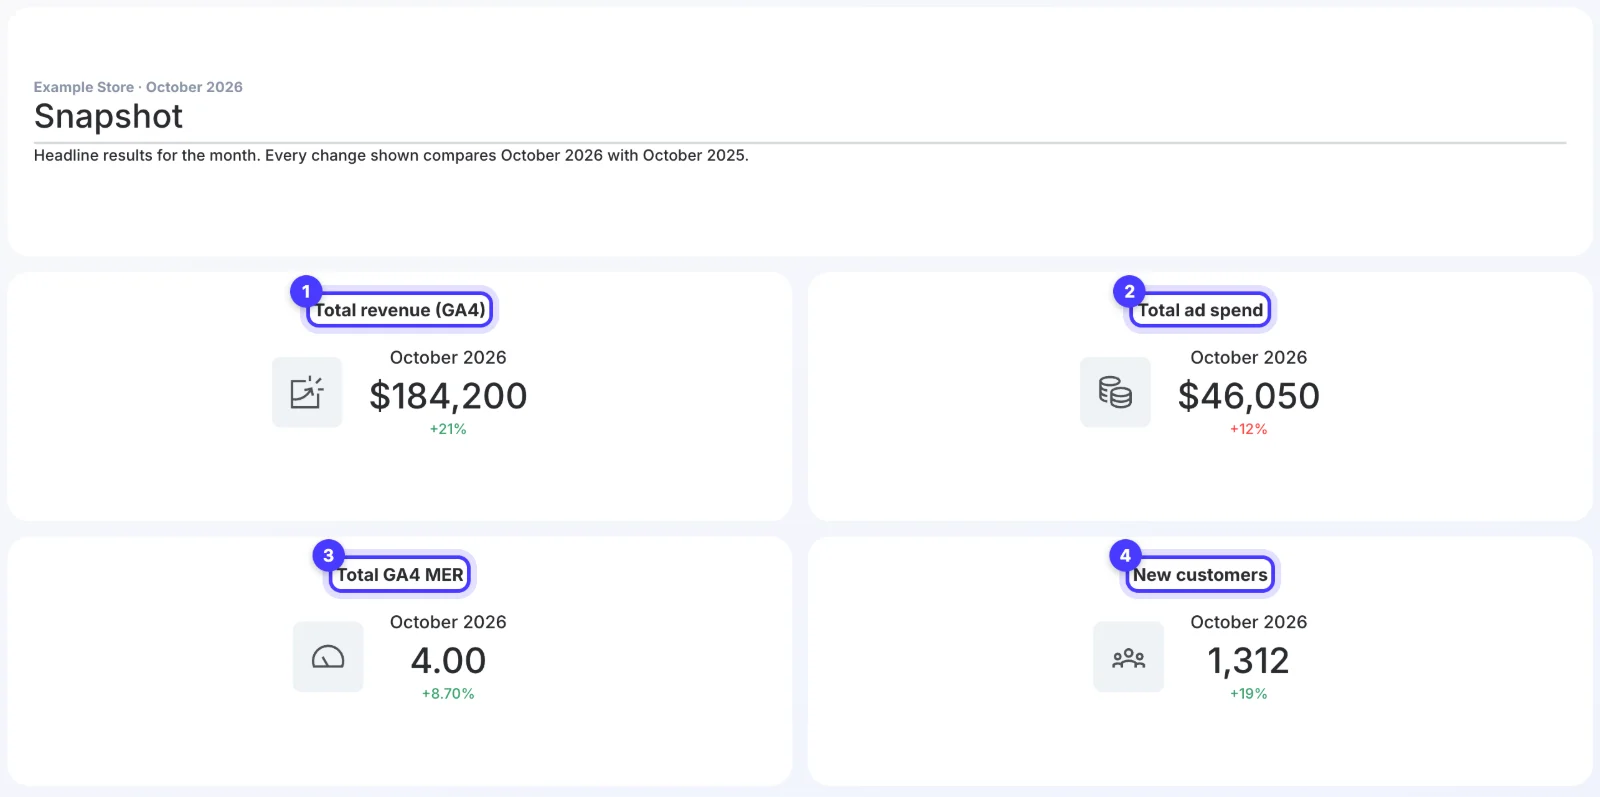
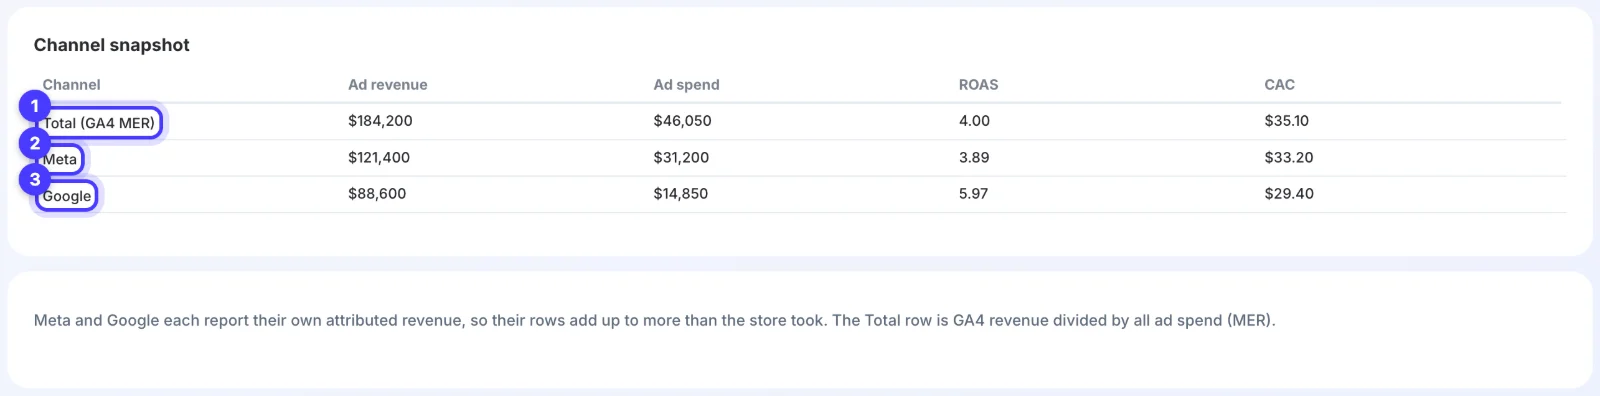
Example Store is an invented Australian homewares brand on Shopify. Here is its Snapshot for one month.
| Row | Revenue | Ad spend | ROAS or MER | CAC |
|---|---|---|---|---|
| Total (GA4) | $184,200 | $46,050 | MER 4.00 | $35.10 |
| Meta | $121,400 | $31,200 | 3.89 | $33.20 |
| $88,600 | $14,850 | 5.97 | $29.40 |
The arithmetic behind each cell:
- Total ad spend: $31,200 + $14,850 = $46,050.
- MER: $184,200 ÷ $46,050 = 4.00. For every dollar spent on ads, GA4 recorded four dollars of revenue.
- Meta ROAS: $121,400 ÷ $31,200 = 3.89.
- Google ROAS: $88,600 ÷ $14,850 = 5.97.
- Overall CAC: $46,050 ÷ 1,312 new customers = $35.10. We work it out from the totals, never by averaging the channel CACs, which makes it spend-weighted: a channel that spends twice as much counts twice as much.
- Channel CACs: Meta's $33.20 and Google's $29.40 use each platform's own count of new customers, about 940 and 505. Both sit below the $35.10 total, which only happens because the platforms claim around 1,445 new customers between them against the store's 1,312. Both claim some of the same people.
- The averaging trap: ($33.20 + $29.40) ÷ 2 = $31.30. That understates the real cost by $3.80 a customer.
- The adding-up trap: Meta and Google claim $121,400 + $88,600 = $210,000, which is $25,800 (14%) more than GA4 recorded. A "ROAS" built on that sum would read 4.56 instead of 4.00.
The month worked if 4.00 clears the store's break-even, which comes from its margin (our break-even ROAS guide shows the sum). The channel rows then guide decisions inside each platform. Before comparing any rows, check that every revenue figure sits on the same GST basis; the GST section of our MER guide shows how.
The rest of the template, tab by tab
Our master ecommerce template has seven tabs: Snapshot, Website data, Meta ads, Meta ads creative, Google ads, Audience and AI tracker. Search Console feeds an SEO tab for clients with SEO work, and Pinterest or TikTok tabs go in only where there is real recent spend. A tab for a channel with no spend is noise.
| Tab | The question it answers |
|---|---|
| Website data | Did the site turn visits into sales? GA4 sessions, revenue and conversion rate, new against returning visitors, and where visitors are. |
| Meta ads | Which campaigns spent the money and what each returned by Meta's count. Our Meta ads report guide covers this tab. |
| Meta ads creative | Which ads did the work, shown as the ads themselves with spend and results beside each. |
| Google ads | Spend, conversions, conversion value and Conversion value/cost (Google's ROAS column) by campaign. See our Google Ads report guide. |
| Audience | Who bought and from where: age, gender, location and device. |
| AI tracker | Visits GA4 records from AI assistants such as ChatGPT. |
| SEO, where relevant | Search Console clicks, impressions and the queries behind them. |
Two layout rules we hold to. Tables run full width, because half-width tables clipped values. And the report carries no explainer text boxes: caveats go in our message to the client.
The written summary goes in the message
A report shows what happened. It cannot say why, or what happens next. That is the job of a short written summary, and we send it in the message that carries the report. A text box inside a report has to be rewritten every period, and an old one left in place says the wrong thing.
Our summary runs to four lines:
- The result: MER and total revenue against the target and against the same month last year.
- What moved it: one or two causes, named plainly, such as a new video or a sale.
- What we will do next month: the changes and the budget.
- Anything to check: a tracking gap, a stock problem or a caveat on one of the numbers.
For Example Store it might read: "MER 4.00 on $46,050 of spend, above the 3.59 that covers your fixed costs. Google returned 5.97 by its own count. Next month we hold spend at about $46,000, launch three new Meta videos and add the new range to Shopping."
Cadence: monthly on the 1st, weekly on Mondays
- Monthly report: a scheduled email on the 1st covering the month just finished, PDF attached.
- Weekly report: a scheduled email every Monday, PDF attached.
- Live dashboard: a rolling last 30 days against the same period last year, refreshed every 4 hours and embedded in each client's Hey Sage portal.
The emails go out on our own email theme with a link to the client's portal, white-labelled with our branding (our white-label reporting guide covers that setup). Weekly and monthly reports are separate copies of the client's dashboard, so we check the dashboard and every copy before delivery. The automation history, not the report editor, is our record of what was sent.
Weekly is for catching problems early, such as a campaign that stopped spending or a broken checkout. Monthly is for decisions about budget and direction. If you only read one, read the monthly.
Questions to ask of your monthly report
Whoever builds your report, these questions tell you whether you can trust it:
- Where does the total revenue come from, GA4 or the store, and does the label say so?
- Is anyone adding Meta's and Google's revenue together to make a total?
- What is my break-even MER, and did this month clear it?
- Does CAC count new customers only, and is the overall figure total spend divided by total new customers?
- Is every revenue figure on the same GST basis?
- What changed against last month and the same month last year, and why?
- Did anyone change which actions count as conversions? In Google Ads only primary actions feed the Conversions column, so switching an action from secondary to primary can lift the count with no extra sales.
- What will you do next month, with what budget, and how will we know it worked?
If your current report cannot answer most of these, you can hand the reporting and the ads to us.
See the decisions behind real ads.
46 ad breakdowns and 17 landing pages, each with the next test it suggests.
The lead-gen version: spend, key events, cost per key event
A business that sells through enquiries has no revenue in the ad platforms, so ROAS and MER have nothing to measure. Our leads template swaps the money columns for three: spend, key events and cost per key event. There is no ROAS anywhere in it.
A key event is a GA4 event you mark as important, such as a form submission, a booking or a click to call. GA4 counts every time someone triggers one, and a standard property can hold up to 30. Mark the one or two that are real enquiries, not page views or button clicks.
| Row | Ad spend | Key events | Cost per key event |
|---|---|---|---|
| Total (GA4) | $9,600 | 240 | $40.00 |
| Meta | $6,000 | 170 (Meta's count) | $35.29 |
| $3,600 | 118 (Google's count) | $30.51 |
The same rule applies: the platforms claim 288 enquiries between them against GA4's 240, so the rows are never added. Then take the count to your CRM, because a form fill is not a customer. Our guide to improving lead quality from paid ads shows how to send qualified leads back to the platforms.
How we build it in Whatagraph
Every client report we send is built in Whatagraph on Meta Ads, Google Ads and GA4, from one master template. A new client report takes six steps:
- Duplicate the master template.
- Swap in the client's sources, matching every account by ID, channel and currency.
- Clone the ad blend and the MER blend. The MER blend joins Meta spend and Google spend with GA4 revenue, so one formula can divide across all three.
- Create the client's formula metrics, such as MER.
- Rebind every widget to the new sources and blends.
- Check each tile against the raw numbers in Ads Manager, Google Ads and GA4 before anything is shared.
For delivery, open Automation from the report's right-side menu, set the frequency, delivery day, time and time zone, choose whether you review before sending, add the recipients and include the PDF. Whatagraph stores past automated reports, so you can download what went out.
One trap, from Whatagraph's own help centre: a blend inflates totals when one source is broken down further than the other. If Facebook Ads rows are split by placement and Google Ads rows are not, each Google spend value repeats once per placement row. Keep both sides of a blend at the same level of detail, and check total spend against the two platforms.
Whatagraph is priced for agencies: the Max plan starts at US$812 a month billed annually, with 50 credits, and each connected account (one Facebook Ads account, say) uses a credit. A single store can do without it: GA4, Ads Manager, the Google Ads Report editor (which can email a report on a schedule) and a spreadsheet for MER cover the job. Whatagraph earns its price when you report on many accounts every week, and our Whatagraph review sets out its limits. If you report at that scale, our link gives you a free trial and 30% off the first three months: try Whatagraph on your own accounts.
Questions we get about monthly marketing reports
What should a monthly marketing report include?
A Snapshot table first: one row per ad channel with revenue, spend, ROAS and CAC, plus a Total row showing MER, total revenue divided by total ad spend. Then website data, each channel's detail, creative, audience and SEO where relevant. Put the written summary of what changed and what happens next in the email that carries the report.
How do you write a monthly marketing report?
Start from the numbers that decide the month: total revenue, total ad spend, MER and CAC against your targets. Then write four lines in the covering email: the result, what moved it, what you will do next month and anything to check. Keep explanations out of the report itself.
Should I add Meta and Google revenue together in my report?
No. Each platform credits sales by its own rules, Meta includes view-through purchases, and both can claim the same order. Use GA4 or store revenue for the total and divide it by total ad spend to get MER.
What is the difference between a weekly and a monthly marketing report?
A weekly report catches problems early, such as a campaign that stopped spending or a broken checkout. A monthly report supports decisions about budget and direction and compares against the month before and the same month last year. We send weekly reports on Mondays and monthly reports on the 1st.
What goes in a monthly ads report for a lead generation business?
Spend, key events and cost per key event for each channel, plus a Total row from GA4. Leave ROAS out, because the platforms have no revenue to count. Then check how many of those key events became qualified leads in your CRM.
Sources
- Whatagraph: Pricing
- Whatagraph Help Center: How to automate a report
- Whatagraph Help Center: PDF attachment generation
- Whatagraph Help Center: Blended sources, building unified views from multiple data sources
- Whatagraph Help Center: Why are my blended metrics showing inflated numbers?
- Google Analytics Help: Key events
- Google Analytics Help: Dimensions and metrics
- Google Ads Help: About primary and secondary conversion actions
- Google Ads Help: About conversion values
- Google Ads Help: Create and manage reports
Disclosure: Hey Sage uses Whatagraph for client reporting and earns a referral fee when you subscribe through our Whatagraph links.