
On this page
How far did shoppers get?
Across 79 Hey Sage custom ecommerce landing pages for ten brands, we recorded 125,298 page visits in PostHog. A visit here is a tracked session on a particular page. One person can contribute visits to several pages or come back on another day. The pages included product campaigns, product-family campaigns, collection campaigns and advertorials. All traffic sources were eligible.
| Observed on the page | Page visits | Share of visits |
|---|---|---|
| Page visited | 125,298 | 100% |
| Reached 50% scroll depth | 21,321 | 17.0% |
| Reached 90% scroll depth | 7,398 | 5.9% |
| Clicked a tracked call to action | 25,160 | 20.1% |
A shopper can take an offer before scrolling halfway and can appear in several rows. The table describes reach. Section exposure or a customer interview can tell you more about a specific review or buying question. A fast click through to the store can be a good outcome for a short visit. As a check, we also counted each of the 37 pages with at least 100 visits equally. The middle page recorded 16.9% halfway reach and 8.1% reach at 90% depth.
What happened when we ranked the same pages by purchases?
We could match the page analytics to one Google Analytics 4 (GA4) reporting source for 28 pages across seven brands with at least 100 sessions in each system. These pages accounted for 86,708 PostHog page visits, including 20,685 visits with a CTA click. GA4 separately recorded 94,970 landing sessions and 675 purchase events. Each rate uses its own system’s session count.
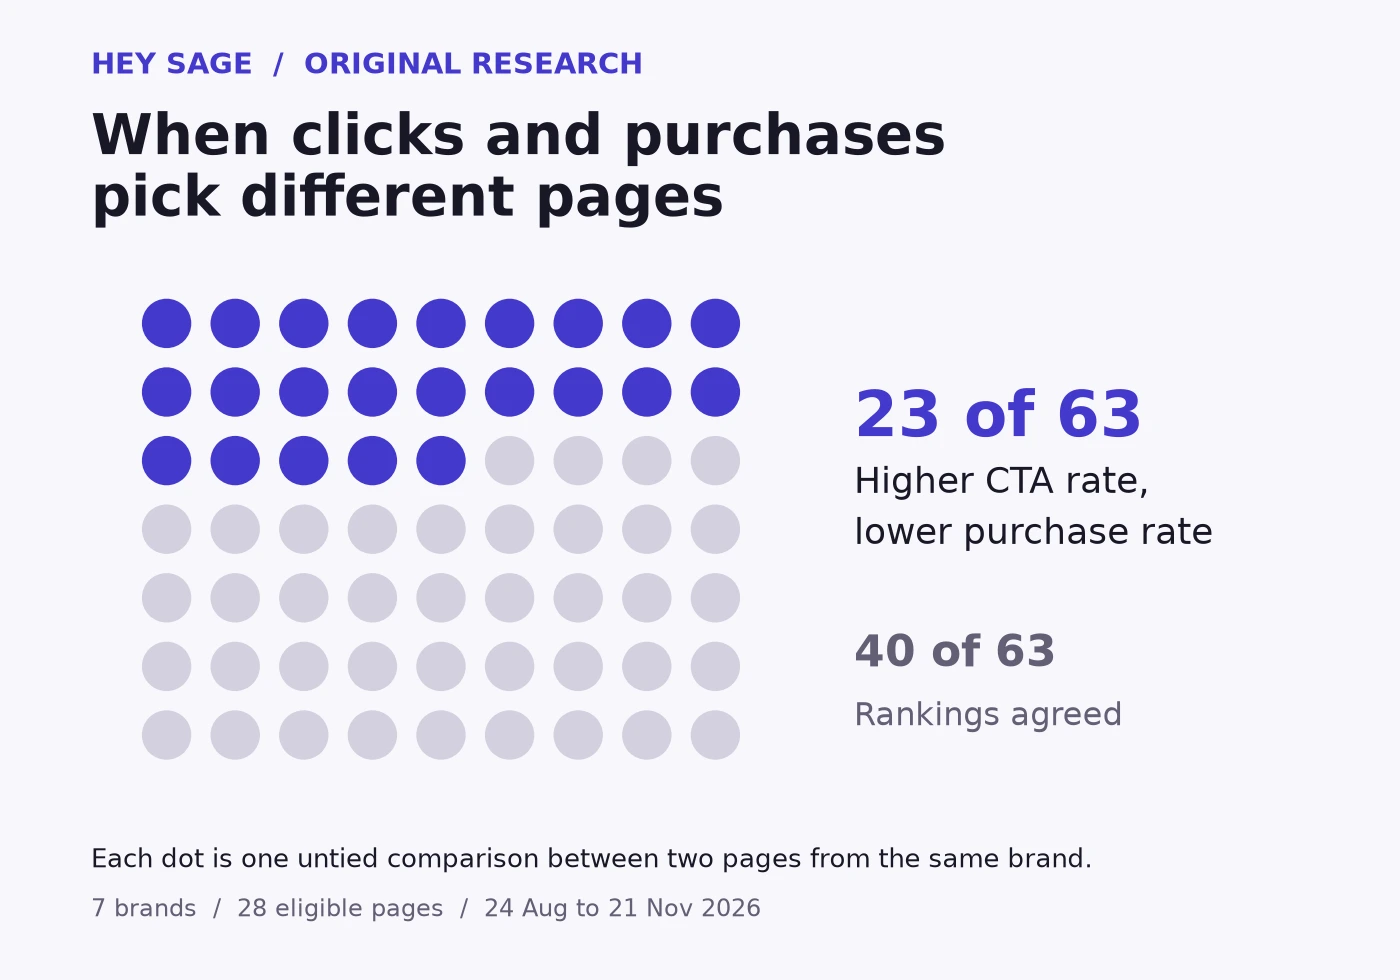
For each brand, we took every distinct pair of eligible pages. Which had the higher share of visits with a CTA click? Which had the higher share of landing sessions with a purchase? Of 66 pairs, three tied on at least one measure. Of the other 63, the two measures picked the same page 40 times. In 23 of 63 comparisons (36.5%), the page with the higher CTA rate had the lower purchase-session rate.
Those are page comparisons. For example, if a brand runs a product explainer, a bundle offer and a collection page, it contributes three pairs. The three pages might serve quite different shoppers. The observation tells us how often the two rankings diverged in our pages. Testing which page works better for the same audience requires sending comparable visitors to each version.

Run Better Ads: our free ecommerce guide
We’ve tracked $700m+ in ad revenue across 200+ brands. See how we work out what a sale can cost and choose which ad to test next.
Does the finding hold on busier pages?
| Minimum sessions per page in each tool | Brands with pairs | Opposite rankings / untied pairs |
|---|---|---|
| 100 | 7 | 23 / 63 (36.5%) |
| 250 | 5 | 16 / 39 (41.0%) |
| 500 | 3 | 11 / 25 (44.0%) |
One brand supplied 43 of the 63 untied comparisons at the main threshold. A brand with many campaign pages has many chances to contribute a pair. When we calculated disagreement within each brand first and then averaged those seven percentages, the figure was 22.4%. Both calculations point to cases where choosing on clicks alone changes the decision. The precise percentage depends on which brands and pages you count.
Raising the traffic minimum also changes the mix of brands. The last row contains three brands. Reading down the table as if higher traffic caused more disagreement would mistake a change in the sample for a change in shopper behaviour.
What we would change on a page
Open the page on a phone and find the first place a shopper can answer the question that brought them there. For a bundle, that might be which sizes are included and what buying them together saves. If the first clear answer sits below the halfway mark, try moving that answer beside the first buying decision. Leave the full size guide further down for people who want the detail. Track exposure to the actual section because halfway down a long advertorial can be well past the bottom of a short product page.
Then follow a CTA yourself. A prominent “shop the range” button can take someone to a collection where they still have to find the advertised item. An illustrative alternative is to link straight to that item with the advertised variant selected. Record where each button goes, whether the destination has stock and whether the original price or offer carries through. Our custom landing page build guide shows how we track individual placements.
For the next test, send comparable traffic from the same ad to the two versions. Pick the purchase measure before launch, keep the offer and tracking consistent, and look at revenue per landing session if order sizes differ. Keep the CTA measure to diagnose the step between the ad and checkout. Our cold traffic landing page planner helps estimate how much traffic that test will need.
How to reproduce the comparison
Hey Sage analysed its own campaign page reporting on 22 November 2026. We summed daily PostHog page-session counters for each campaign page from 24 August through 21 November inclusive. The scroll table includes pages with at least one tracked visit. For the purchase comparison we matched the brand and stable page identifier across systems, grouped revisions under the same page, and excluded ambiguous GA4 matches. Each eligible page needed at least 100 sessions on both sides over the same dates.
CTA rate divides sessions with any tracked CTA click by PostHog page sessions. Purchase rate uses GA4’s purchase-specific session key event rate. Multiple purchases in one session can increase purchase events while that session still counts once in the purchase rate. We compared the two page-level rankings within a brand. The two tools recorded separate session populations, and each campaign reached the audience it ordinarily served. A shopper’s visit can recur across pages and a page can recur across pairs.
Download the aggregate findings (CSV). For the budget decision after testing a page, see our three-year ad spend scaling study.