
On this page
What the A$65.6 million covers
We looked at 36 complete calendar months of ecommerce advertising in accounts connected to Hey Sage, from 1 November 2023 to 31 October 2026. We kept the identity of each ad account through time so we could compare one month with the month before it. A pooled chart for the whole portfolio would rise or fall whenever a large advertiser entered or left the group.
| Measure over 36 months | Meta Ads | Google Ads |
|---|---|---|
| Accounts with spend | 22 | 24 |
| Account-months with spend | 676 | 714 |
| Media spend | A$41.0m | A$24.6m |
| Platform-reported value | A$122.0m purchase value | A$160.0m conversion value |
Each month appears once per account in the coverage figures. Historical reporting can include periods before a brand worked with us. Meta’s value is the value it attributed to purchases. Google’s is the value of the conversion actions included in the account’s reporting. Two platforms can claim the same order, so a combined revenue figure would double-count an unknown amount. The spend figure adds the two platforms’ media costs.
When spend grew, what happened to reported value and ROAS?
We found 916 eligible comparisons between consecutive months in the same account. Daily spend rose by at least 20% in 259 of them. These increases came from 19 Meta accounts and 16 Google Ads accounts. An account can appear in several months. Here is the complete breakdown, using daily value to allow for different month lengths.
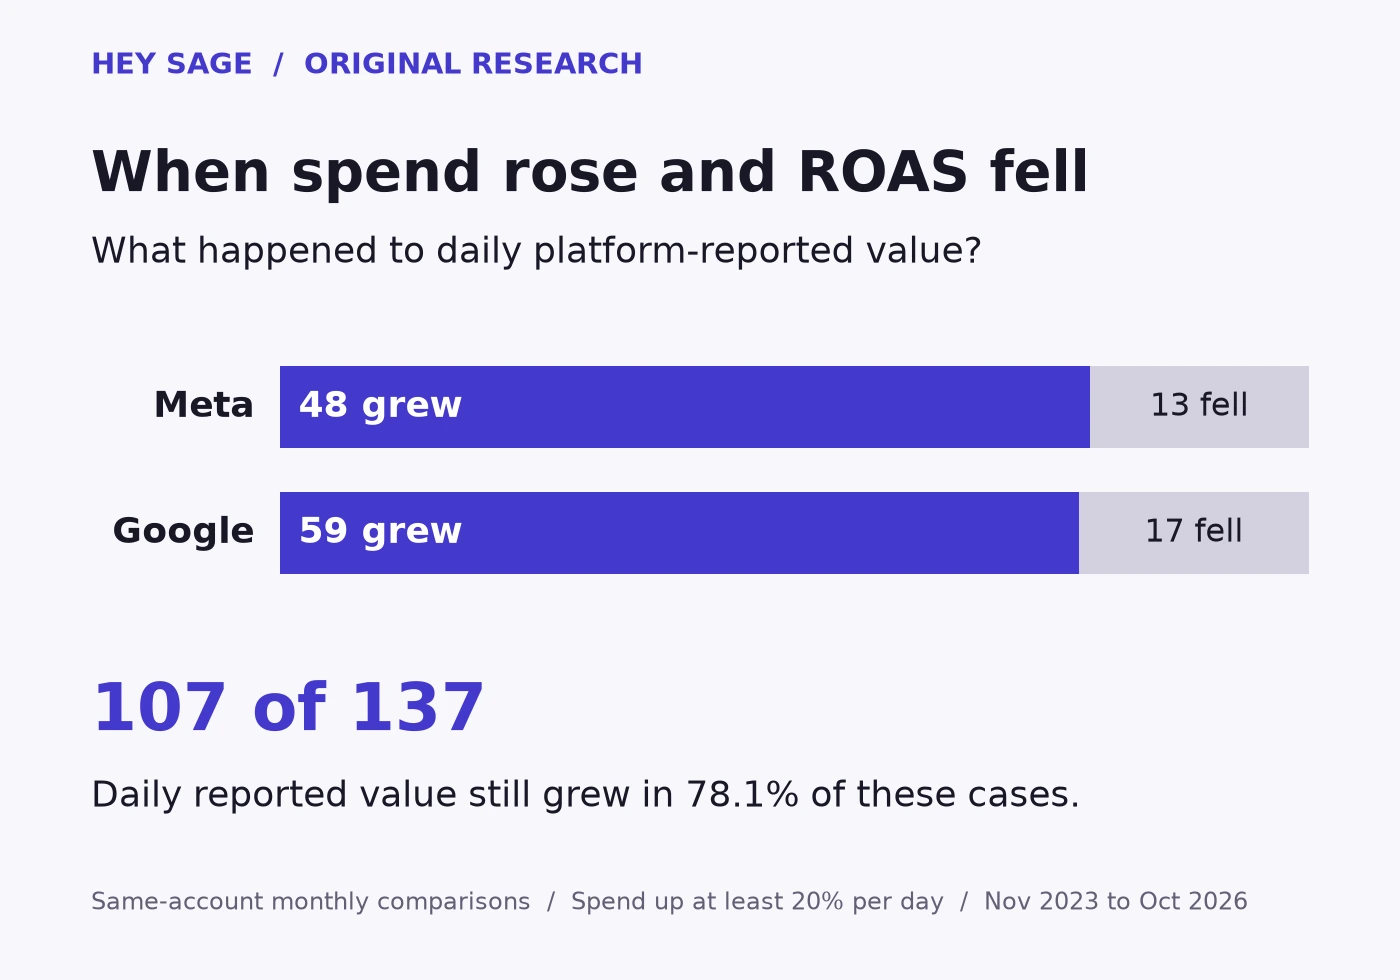
| After daily spend rose at least 20% | Meta (142) | Google (117) |
|---|---|---|
| Daily value rose and ROAS rose | 81 | 41 |
| Daily value rose and ROAS fell | 48 | 59 |
| Daily value fell and ROAS fell | 13 | 17 |
On Meta, daily purchase value rose in 129 of 142 increases. On Google, daily conversion value rose in 100 of 117. Look specifically at the cases where ROAS fell and the picture is striking. Daily value still grew in 48 of 61 on Meta (78.7%) and 59 of 76 on Google (77.6%). That is 107 of 137 across both platforms. The other 30 cases had both higher spend and less reported value per day.
A falling ratio alone therefore leaves an important question open. Did the account spend more to bring in fewer dollars, or did the next tranche of spend bring in additional dollars at a lower return? Both occurred in this dataset. They call for different conversations with the person managing the account.

Run Better Ads: our free ecommerce guide
We’ve tracked $700m+ in ad revenue across 200+ brands. See how we work out what a sale can cost and choose which ad to test next.
How much more value showed up per extra dollar?
For each of the 259 increases we subtracted the earlier average daily value from the later average daily value. We divided that change by the change in daily spend. We kept negative results. The middle observation on each platform was A$2.81 on Meta and A$3.44 on Google in extra reported value per extra A$1 of daily spend. Each increase counts once in its platform’s median.
Consider a store that moves from A$1,000 to A$1,500 per day on ads while reported purchase value moves from A$4,000 to A$5,250. This is a worked example. Its average ROAS falls from 4.0 to 3.5. The extra A$500 of daily spend coincides with A$1,250 of extra daily value, or A$2.50 per additional dollar. If the store independently confirms those additional sales and keeps 40 cents of contribution per dollar before advertising, the additional contribution is A$500. That covers the additional media cost exactly.
Use your own sales, margin after variable costs, refunds and tax treatment for that calculation. Then check what happened to new customers and available stock. The break-even ROAS guide works through the margin arithmetic. Our MER and ROAS guide explains how to check the store total against each platform’s claim.
Does the pattern depend on the threshold or the sale season?
| Daily value up and ROAS down, out of all qualifying increases | Meta | |
|---|---|---|
| At least a 20% increase | 48 / 142 (33.8%) | 59 / 117 (50.4%) |
| At least a 30% increase | 39 / 115 (33.9%) | 48 / 84 (57.1%) |
| 20% or more, excluding pairs touching November or December | 40 / 109 (36.7%) | 54 / 93 (58.1%) |
These percentages use every qualifying increase as their denominator. The 78.1% headline asks a narrower question about the cases where ROAS fell. We also calculated the main result separately for each account and averaged those percentages, so advertisers with frequent increases had no extra weight. Daily value rose while ROAS fell in an account-weighted 32.4% on Meta and 47.4% on Google.
The pattern survived removing months around Black Friday and Christmas. Other seasonal effects, product launches and stock changes still matter. Brands also choose to raise spend when they expect demand to grow. The channel differences reflect the accounts, conversion settings and campaigns in each group. A store evaluating its next dollar needs its own channel-level costs and margins.
How to repeat this with your own account
Export monthly spend and reported purchase or conversion value from a single ad account. Write down the currency, value definition and attribution settings. Divide both columns by the number of calendar days in each month. Keep adjacent, complete months where average spend was at least A$100 per day in both and the first month had positive reported value. A measured zero in the second month stays in the comparison. A missing observation breaks the pair.
Flag each pair where the later daily spend is at least 1.2 times the earlier daily spend. Calculate each month’s ROAS from its total value divided by its total spend. We used monthly account-level exports from Whatagraph’s ecommerce Meta and Google groups in AUD and reconciled each month’s account sums to the group totals. The calculation measures observed changes in realised spend. To estimate sales caused by the extra spend, compare a group exposed to the increase with a suitable holdout.
Hey Sage analysis, 22 November 2026. Download the aggregate results (CSV). For a related measurement decision, see our study of ecommerce landing page clicks and purchases.